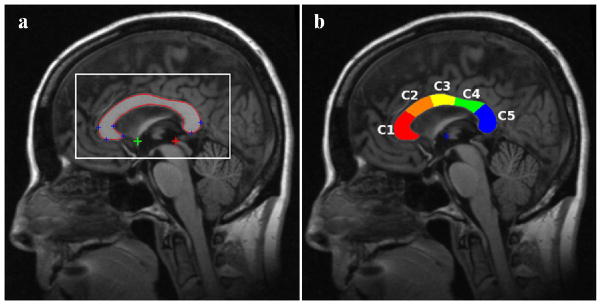
Figure 1.

(a) Automatically detected MSP, AC (green plus sign), PC (red plus sign), and several CC landmarks (blue plus signs) on the MSP. The rectangular box shows a window around the CC that is defined based on prior information from atlases about CC location on standardized MSP images. Correlations between the gray level in this window and the test image are used for atlas selection prior to non-linear registrations. (b) CC sub-regions measured automatically by yuki based on Hampel’s definition (CC1: genu, CC2: anterior body, CC3: mid-body, CC4: posterior body and CC5: splenium).
