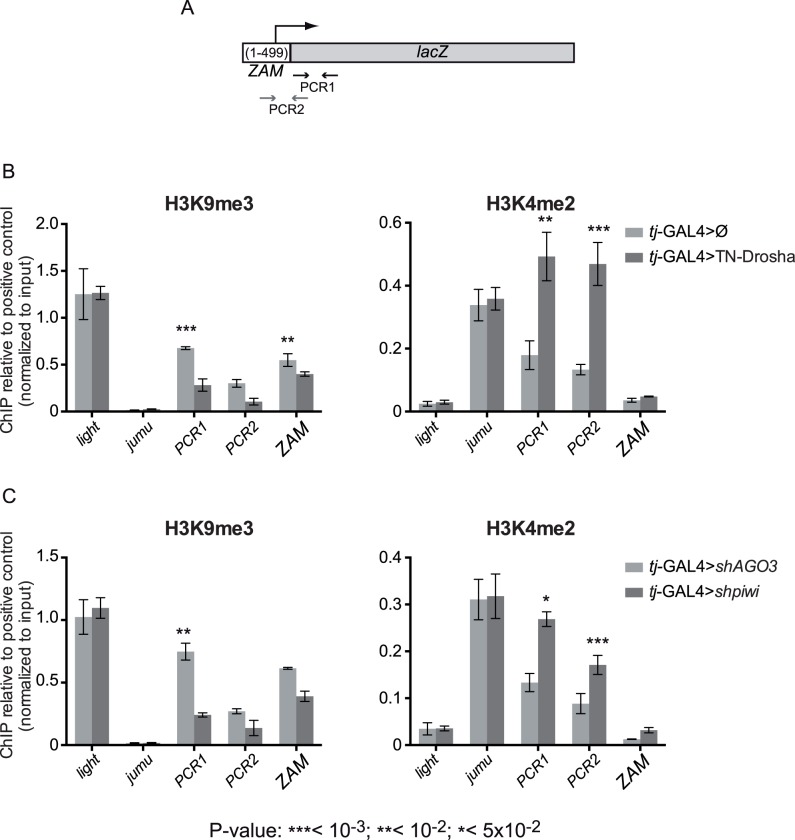
Fig 2. Evidence for miRNA-dependent transcriptional silencing of a follicle cell reporter transgene and an endogenous somatic TE.
(A) Cartoon showing the ZAM region included in the ZAM-lacZ reporter construct and the localization of the PCR-1 and PCR-2 primer pairs (arrows and S3 Table). (B) ChIP-qPCR using ovarian chromatin to monitor the effects of tj-driven expression of the trans-dominant negative Drosha construct (tj-GAL4>TN-Drosha) (dark grey bars). Control ovaries express the somatic driver alone (tj-GAL4>Ø) (light grey bars). (C) ChIP-qPCR using ovarian chromatin to monitor the effects of tj-driven piwi soma KD (dark grey bars). Control ovaries were from AGO3 soma KD flies because AGO3 is not expressed in follicle cells (light grey bars). H3K9me3 enrichment was quantified relative to the 1360-element (positive control) and normalized to input. light and jumu are examples of actively transcribed genes in heterochromatic and euchromatic regions, respectively. H3K4me2 enrichment was quantified relative to RpL15 (positive control) and normalized to input. light was used as a negative control and jumu as an example of actively transcribed euchromatic gene (bars represent the mean ± SD of ≥3 biological replicates); P-values were determined using the two-tailed Student’s t-test, when series had a normal distribution, or the Mann-Whitney test.

