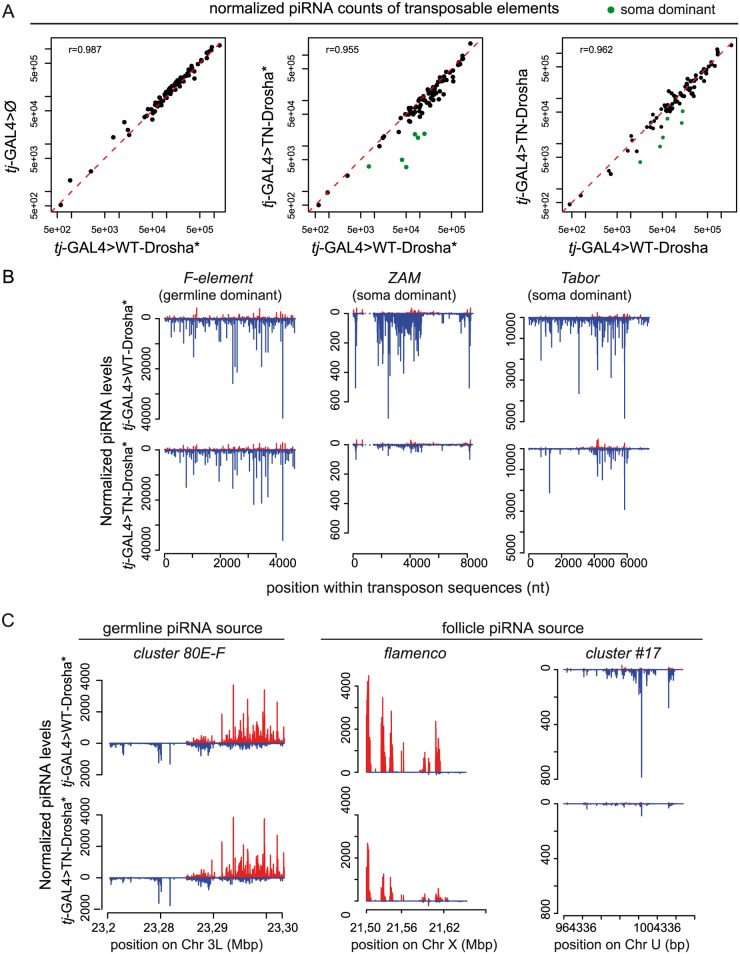
Fig 3. Loss of TE-derived piRNAs in Drosophila follicle cells that express the trans-dominant negative Drosha construct.
(A) Scatter plots show the correlation between the normalized piRNA abundance for each of the 85 most targeted Drosophila TEs (up to four mismatches allowed between reads and RepBase sequence). The Pearson correlation [r] was based on all TEs. piRNA counts were compared pairwise between libraries from transgenic ovaries that contain tj-driven WT-Drosha (x axes), the tj-driver-alone (tj-GAL4>Ø) (y axis, left panel) or tj-driven TN-Drosha (y axes, middle and right panels). The asterisks indicate that the corresponding small RNA libraries were made using ovaries that do not contain the tubP-Gal80ts transgene (see S2 Table). Libraries were normalized to 1 million of piRNAs that map uniquely to 42AB, a germline-specific piRNA cluster. The six follicle cell-specific (soma dominant) TEs (green dots in the middle and right panels) were identified by Malone et al 2009. (B-C) Normalized profiles of ovarian piRNAs (sense: up (red); antisense: down (blue)) that map to TE consensus sequences or piRNA clusters in tj-GAL4>WT-Drosha* (upper panels) and tj-GAL4>TN-Drosha* (lower panels) libraries. The y axis indicates the number of piRNAs the 5’ end of which matches the x axis sequence at a given position. (B) Profiles of piRNAs mapping to the F-element, a germline-specific TE (left), or to ZAM (middle) and Tabor (right), two soma-dominant TEs. (C) Profiles of piRNAs that originate from 80E-F, a germline-specific piRNA cluster (left), or from flamenco (middle) and cluster # 17(right), two follicle cell-specific piRNA clusters (only genome-unique piRNAs are profiled).

