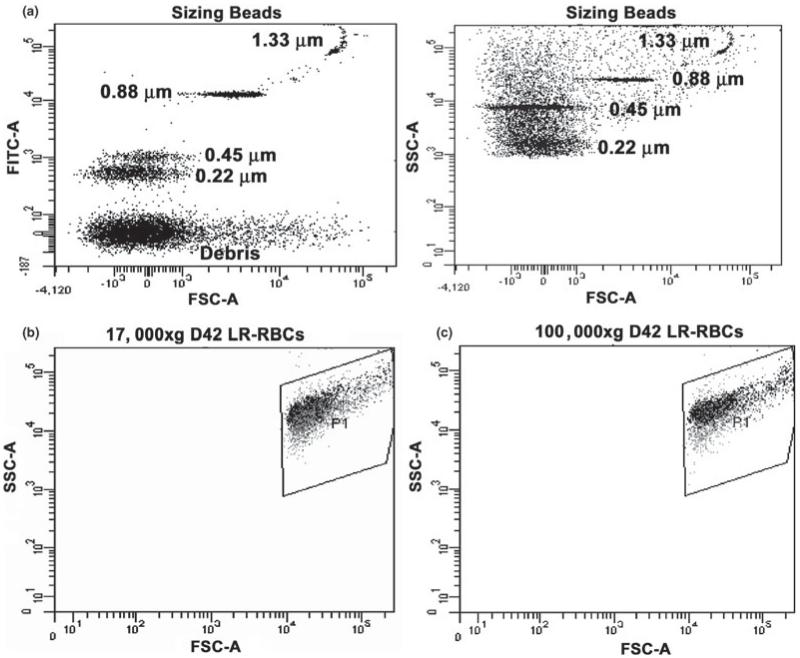
Fig. 1.
Flow cytometric analyses of sizing beads and the MPs from the supernatants of stored D42 LR-RBCs. Panel a depicts scatter plots of the sizing beads with the fluorescence of the FITC channel as a function of forward scatter. As can be seen the specific sizing beads were present at 0·22, 0·45, 0·88 and 1·33 μm with a debris field at the bottom. The panel on the left shows the gating used for the MPs as defined by the sizing beads with the side scatter depicted as a function of the forward scatter of the sizing beads with the debris field not included in the MP gates. Panel b demonstrates the scatter plot of the MPs from the supernatant from D42 LR-RBCs isolated by centrifugation at 17 000 × g for 60 min. Panel c demonstrates the scatterplot of MPs isolated from the identical supernatants from D42 LR-RBCs isolated by centrifugation at 100 000 × g for 120 min. These data are virtually identical and represent a sample size of 6.

