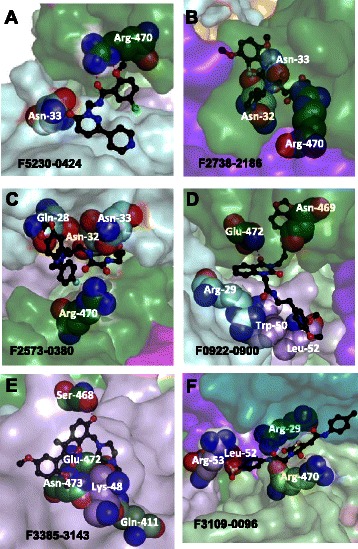
Fig. 5.

Identified hits in their docked poses highlighting key intermolecular interactions. Panels a-c show ligands that dock in Box 2, panels d and e show ligands that dock in Box 3, panel f shows ligands that dock in Box 1. Each ligand is shown in ball-and-stick representation with the carbons in black and other atoms in CPK. The surrounding binding pockets formed by EGFR and EGF are shown as transparent surfaces and are colored by domain as in Fig. 1. In each panel, residues from EGFR or EGF that form hydrogen bonds or ring-stacking hydrophobic interactions with the ligand are shown as spheres with the carbons colored by domain and other atoms in CPK. Hydrogen bonds are shown as dashed red lines. The orientation varies among the panels to best show the structure of each ligand
