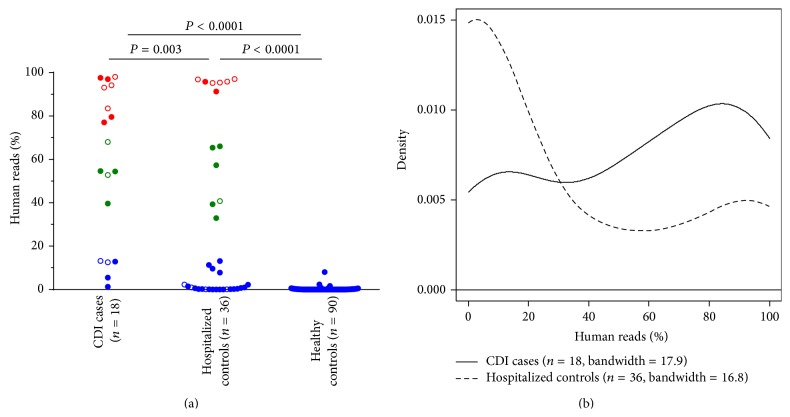
Figure 1.
Distribution of human read proportions in fecal samples from CDI cases, hospitalized controls, and healthy subjects. (a) Scatter plot showing the proportions of human reads in each subject group. Patients admitted to the hospital for gastrointestinal problems (8 cases and 10 controls) are displayed as open circles. Three subgroups representing low (<30%, shown in blue), intermediate (30–70%, shown in green), and high (>70%, shown in red) amounts of human DNA were apparent from the sample distributions. P values were determined by Mann-Whitney U test. (b) Kernel density plot showing the distribution of human read proportions in CDI case and hospitalized control groups.

