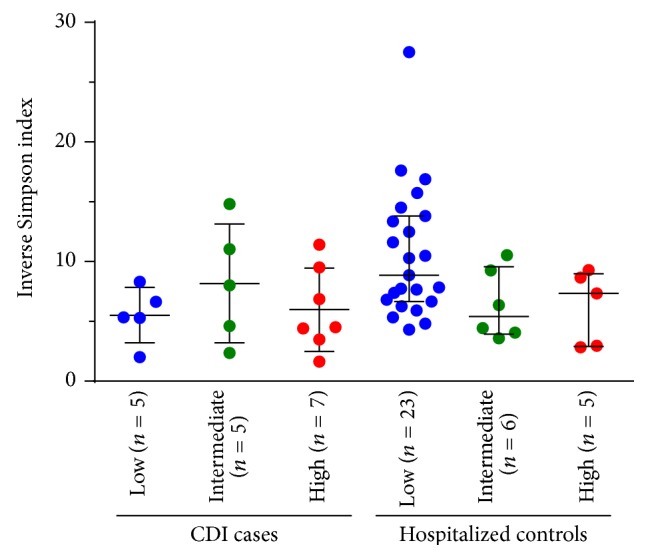
Figure 2.

Intestinal microbiota diversity in hospitalized cases and controls as a function of host DNA abundance. Each patient group was divided into three subgroups with low (<30%, shown in blue), intermediate (30–70%, shown in green), and high (>70%, shown in red) proportions of human reads. One sample from the CDI group and two samples from hospitalized controls were excluded because they contained less than 15 reads with a 16S rDNA motif. Horizontal lines represent the median and interquartile range.
