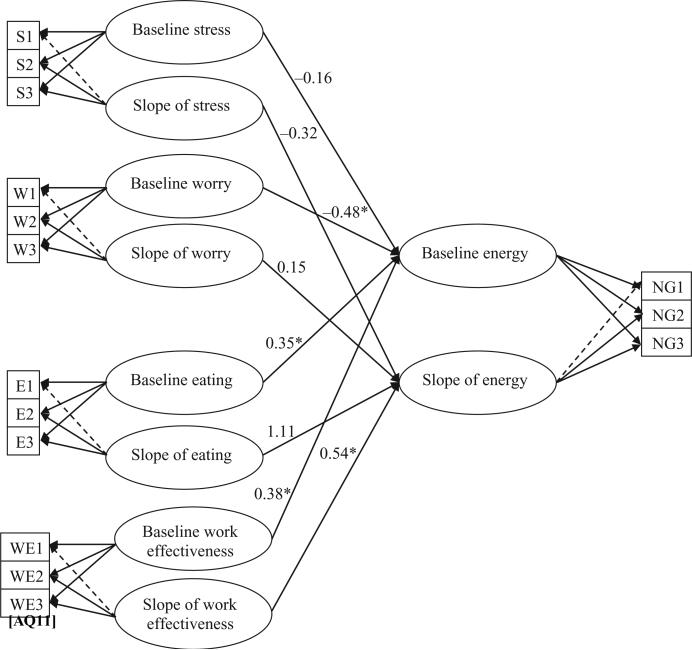
FIGURE 2.
Latent growth model depicting the prediction of change in energy over time. Baseline levels of stress, worry, satisfaction with eating habits, and work-effectiveness predict baseline energy levels, but linear change in energy is predicted only by linear change in perceptions of work-effectiveness over time. Directional pathways that are significant at P < 0.05 are denoted with a. *Baseline stress correlated significantly with baseline worry (r = 0.43; z = 5.25) and baseline satisfaction with eating habits (r = –0.27; z = –3.42). These correlations are not shown in the figure for reasons of clarity.

