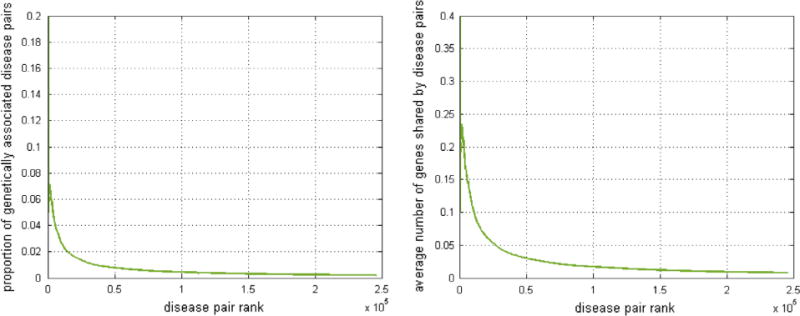
Fig. 4.

Correlation between manifestation similarities and genetic associations. Left: Correlation between proportion of genetically associated disease pairs (x-axis) and the phenotype similarity ranks (y-axis) in DMN. Right: Correlation between the average numbers of genes shared by disease pairs (x-axis) and the phenotype ranks (y-axis) in DMN. Diseases with larger phenotype similarity in DMN tend have stronger genetic association.
