
Figure 2. Dependence on SC and modulation by the corticotectal projection to SC.
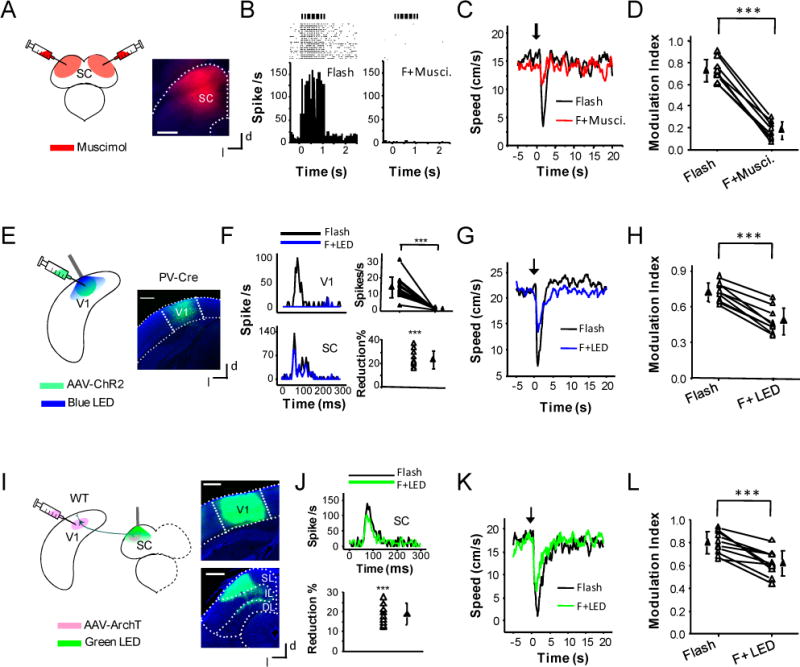
(A) Experimental condition: fluorescent muscimol was injected into the SC bilaterally. Right, image showing the spread of muscimol. Scale bar: 500 μm. d, dorsal; l, lateral.
(B) Raster plot (upper) and peri-stimulus spike time histogram (PSTH) for multi-unit spike responses (20 trials, bin size = 5ms) to a train of flashes (50 ms duration, 10 Hz, each pulse marked by a vertical bar) before (left) and after (right) the bilateral injections of muscimol into the SC, recorded in the superficial layer of SC.
(C) Average speed profile of a mouse before (black) and after (red) the muscimol injection.
(D) Comparison of modulation indices before and after silencing the SC. ***, p < 0.001, paired t-test. N = 8 animals. Data points for the same animal are connected with a line.
(E) Experimental condition: AAV-DIO-ChR2 was injected into the V1 region of PV-Cre mice. Weeks later, blue LED light was applied onto the surface of the visual cortex. Right, confocal image of a brain slice showing the expression of ChR2-EYFP in the V1 region (outlined by two dotted lines). Scale bar: 500 μm.
(F) Upper left, PSTHs for spike responses (bin size = 2 ms) of a V1 L5 neuron to flash stimulation (0.2 s) without (black) and with (blue) co-applying LED illumination (20 ms pulse duration, 25 Hz, 0.2 s long). Upper right, summary of average spike rates evoked by flash stimulation without (Flash) and with (F+LED) co-applying LED illumination for 13 cells in 5 animals. Lower panel, PSTHs for spike responses of a neuron in the superficial layer of SC to flash stimulation without (black) and with (blue) co-applying LED illumination on the visual cortex (left), and summary of percentage reduction of flash evoked spike rate under co-application of LED illumination for 11 cells in 5 animals (right). ***, p < 0.001, paired t-test.
(G) Average speed profile of a mouse without (black) and with (blue) LED illumination on the visual cortex.
(H) Summary of modulation indices without and with LED illumination for 9 animals. ***, p < 0.001, paired t-test.
(I) Experimental condition: AAV-ArchT was injected into the V1 of wild-type mice. Weeks later, green LED light was applied onto the SC surface. Right, images showing ArchT expression in the V1 region (top) and corticofugal axon terminations in the SC (bottom). Scale: 500 μm. SL: superficial layer; IL, intermediate layer; DL, deep layer.
(J) Top, PSTHs for spike responses of a neuron in the superficial layer of SC to flash stimulation (0.2 s) without (black) and with (green) co-applying LED illumination (0.2 s). Bottom, percentage reduction of evoked spike rate under co-application of LED illumination, recorded from 11 cells in 10 animals. ***, p < 0.001, paired t-test.
(K) Average speed profile of an example animal without (black) and with (green) LED illumination.
(L) Comparison of modulation indices without and with LED illumination for 10 animals. ***, p < 0.001, paired t-test.