
Figure 3. V1 can directly drive an arrest behavior via the corticotectal projection to SC.
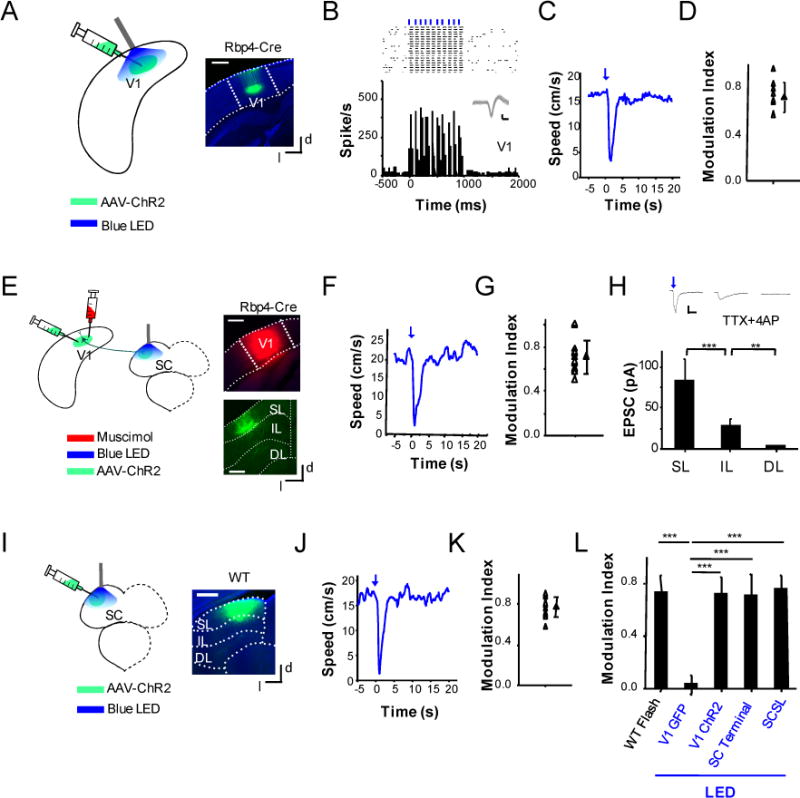
(A) Experimental condition: AAV-DIO-ChR2 was injected into the V1 of Rbp4-Cre mice. Weeks later, blue LED light was applied to the cortical surface. Right, image showing the expression of ChR2 in the V1 region. Scale bar: 500 μm.
(B) Top, raster plot of spikes of a V1 L5 neuron in response to 10 pulses of LED light (50 ms pulse duration, 10 Hz). Each blue vertical bar indicates one LED pulse. Bottom, corresponding PSTH. Inset, 50 superimposed individual spike waveforms. Scale: 50 pA, 1 ms.
(C) Average speed profile of an example animal in response to LED stimulation alone without flash.
(D) Summary of modulation indices resulting from LED stimulation only for 8 animals.
(E) Experimental condition: AAV-DIO-ChR2 was injected into the V1 of Rbp4-Cre mice. Weeks later, blue LED light was applied onto the SC while V1 was silenced with muscimol. Right, images showing the spread of muscimol in the cortex (top) and EYFP-labeled corticotectal axons in the SC (bottom). Scale: 500 μm.
(F) Average speed profile of an example animal in response to LED illumination (50 ms pulse duration, 10 Hz, 1 s long) on the SC without flash.
(G) Summary of modulation indices under LED illumination alone for 12 animals.
(H) Average monosynaptic excitatory postsynaptic currents (EPSCs) recorded from SL (n = 14), IL (n = 14) and DL (n = 11) SC neurons in the same slices evoked by optical activation of corticotectal projections. ***, p < 0.001; **, p < 0.01, t-test. Top inset, average EPSCs of example neurons in each corresponding layer of SC. Scale: 25 pA, 30 ms.
(I) Experimental condition: AAV-CamKIIa-ChR2 was injected into the superficial layer of SC. Weeks later, blue LED illumination was applied to the SC surface. Right, image showing the expression of ChR2-EYFP in SC. Scale: 500 μm.
(J) Average speed profile of an example animal in response to LED illumination on the SC without flash.
(K) Summary of modulation indices under LED stimulation alone for 12 animals.
(L) Comparison of modulation indices under different conditions. V1 GFP: AAV-GFP was injected into V1, which serves as a control (n = 5 animals). ***, p < 0.001, one-way ANOVA post hoc test.