
Figure 5. Characterization of V1 responses to LED stimulation.
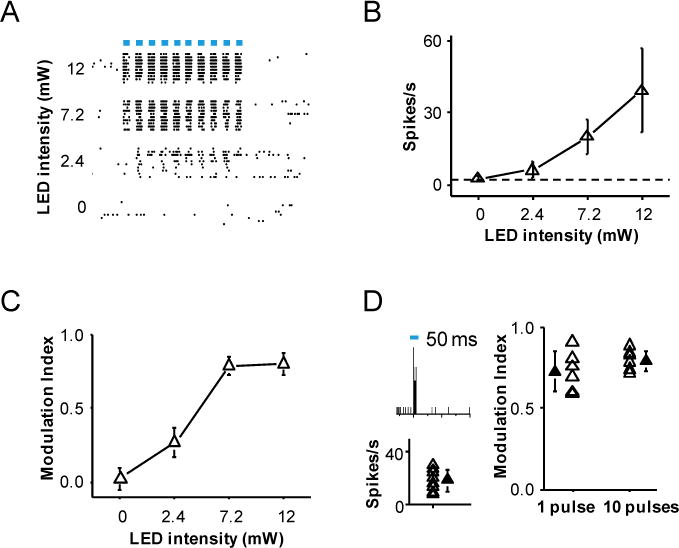
(A) Raster plots of spike responses of a ChR2-expressing L5 neuron (Rpb4-Cre) to a train of LED pulses (10 pulses at 10 Hz) at different intensity levels. Bar labels the duration of each LED pulse (50 ms).
(B) Summary of firing rates at different intensity levels of LED stimulation (n = 17 V1 L5 neurons). Firing rate was measured within the entire time window for the LED train.
(C) MIs measured at different LED intensity levels. Data points for the same animal are connected by lines. N = 7 animals.
(D) Left panel, PSTH for spikes of a L5 neuron to one pulse (50 ms) of LED stimulation (top, intensity = 7.2 mW), and summary spike rates of 9 L5 neurons (bottom). Right panel, comparison of MIs measured at one pulse (n = 6) vs. 10 pulses (n = 7) of LED stimulation. Each open symbol represents one animal. Solid symbol represents mean ± SD.