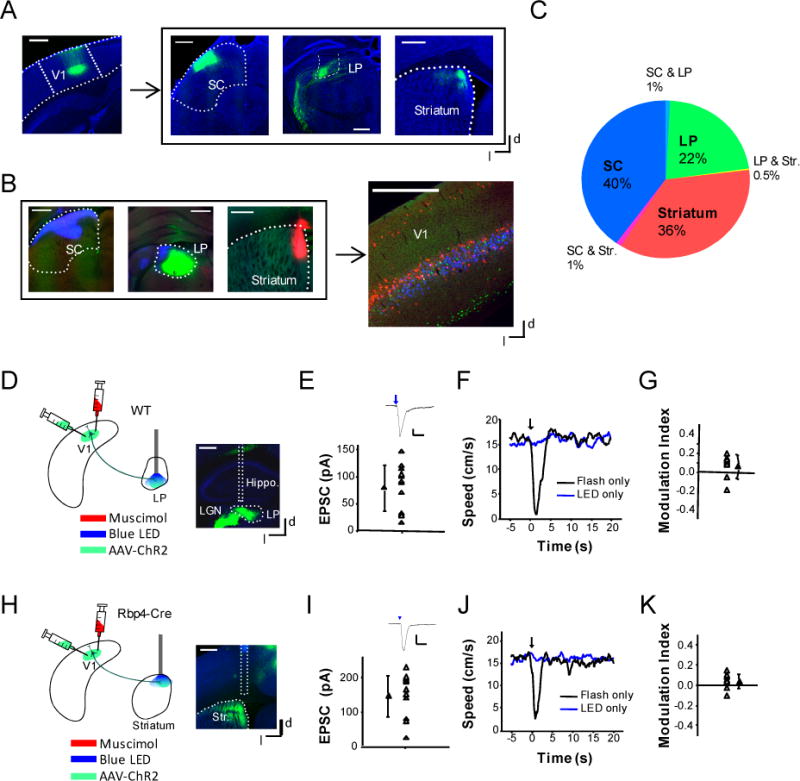
Figure 6. Corticofugal projections to other targets are unlikely account for the arrest behavior.

(A) Left, image of ChR2-EYFP expressing neurons in the V1 of a Rbp4-Cre mouse. Right, fluorescence labeled corticofugal axons in the SC, LP, and striatum (outlined) respectively. Scale: 500 μm.
(B) Retrograde tracing of corticofugal neurons. Left, retrograde tracers of blue, green and red colors were injected into the superficial SC, LP and dorsomedial striatum respectively. Right, distribution of labeled neurons in the V1. Scale: 500 μm.
(C) Quantification of overlap between corticofugal neurons projecting to different targets. Neuron numbers were normalized to the total number of labeled corticofugal neurons.
(D) Experimental condition for head-fixed animals: AAV-ChR2 was injected into the V1 of wildtype mice. Weeks later, blue LED light was applied to the LP via an implanted optic fiber and the V1 was silenced by muscimol. Right, image showing the track of the implanted optic fiber. Scale: 500 μm. Hippo., hippocampus.
(E) Average monosynaptic EPSC amplitudes recorded from 12 LP neurons (in 5 slices) in response to a blue LED pulse (20 ms duration). Bar = s.d. Top inset, average EPSC trace of an example neurons. Arrow marks the onset of LED pulse. Scale: 20 pA, 50 ms.
(F) Average speed trace of an example animal under flash only (black) or LED illumination of the LP only (blue).
(G) Summary of modulation indices under LED illumination of the LP. There is no significant difference from zero (p > 0.05, one-sample t-test, n = 8 sessions from 4 animals).
(H) LED illumination was applied to the dorsomedial striatum (str.). Right, image showing the track of the implanted optic fiber. Scale: 500 μm.
(I) Average monosynaptic EPSC amplitudes recorded from 15 dorsomedial striatal neurons (in 5 slices) in response to optical stimulation of corticofugal axons in the striatum. Scale for top inset: 50 pA, 50 ms.
(J) Average speed trace of an example animal in response to flash only (black) and to LED illumination of the striatum only (blue).
(K) Summary of modulation indices under LED illumination. There is no significant difference from zero (p > 0.05, one-sample t-test, n = 9 sessions from 4 animals).
