
Figure 1.
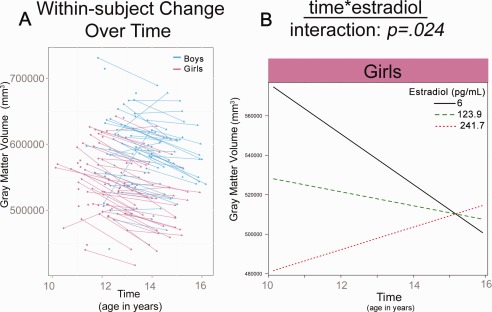
Significant interactions in total gray matter volume development (A) Plot shows raw total gray matter volumes for girls and boys. (B) Plot shows linear multilevel mixed effect fit lines for the effects of time *E2 on gray matter volume.
Official websites use .gov
A
.gov website belongs to an official
government organization in the United States.
Secure .gov websites use HTTPS
A lock (
) or https:// means you've safely
connected to the .gov website. Share sensitive
information only on official, secure websites.
Significant interactions in total gray matter volume development (A) Plot shows raw total gray matter volumes for girls and boys. (B) Plot shows linear multilevel mixed effect fit lines for the effects of time *E2 on gray matter volume.