
Figure 2.
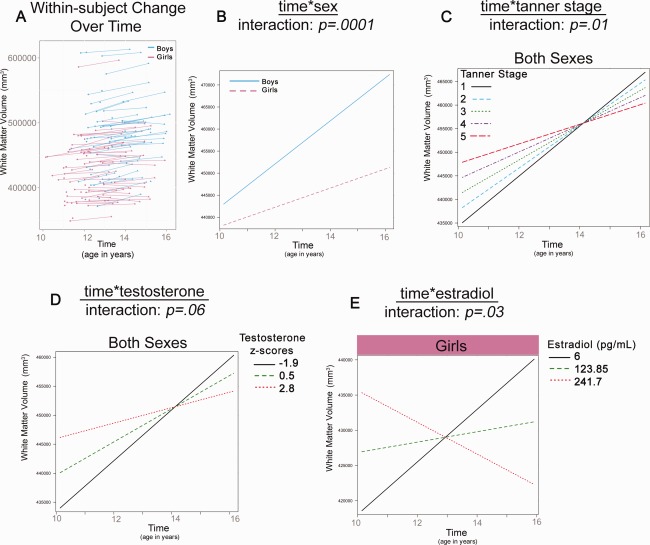
Significant interactions in total white matter volume development (A) Plots show raw total white matter volumes for girls and boys. The remaining plots show the linear multilevel mixed effects fit lines for the effects of time*sex (B), time*Tanner Stage (C), time*T (D) and time*E2 (E) on white matter volume.