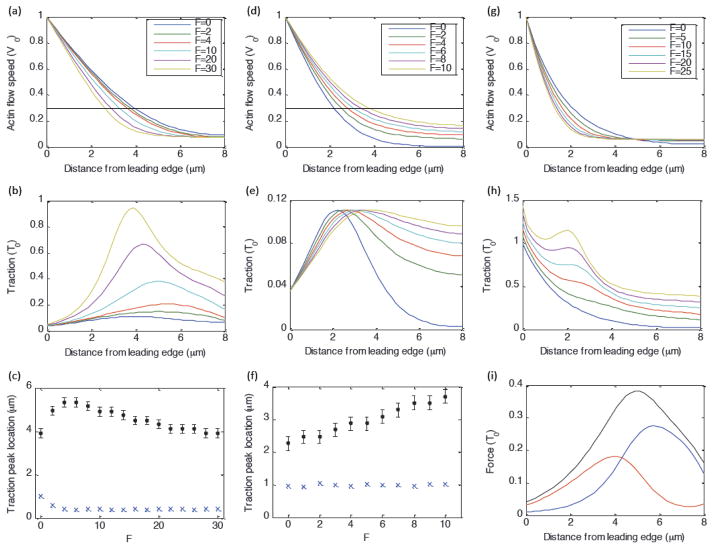
Fig. 4. Role of myosin-dependent and actin-flow-dependent adhesion dynamics.
Unless otherwise stated, parameters are: λ=3, b=15, v*=0.3, and γ=1000. (a–c) Full model with myosin-dependent adhesion strengthening and flow-dependent adhesion weakening. (a, b) Actin flow speed and traction as a function of distance from the leading edge. (c) Position of traction peak in mm (black dots) and actin flow speed (in units of v*) corresponding to traction peak (blue exes) as a function of F. (d–f) Same as (a–c), except without myosin-dependent adhesion strengthening (by setting b = 0). (g–h) Actin flow and traction as a function of distance from the leading edge, in the absence of actin-flow-dependent adhesion weakening (by setting v* ≫ 1). (i)Balance of forces on actin network (traction (black), myosin force (blue), internal viscous force (red)), for F=10, b=15, v*=0.3.

