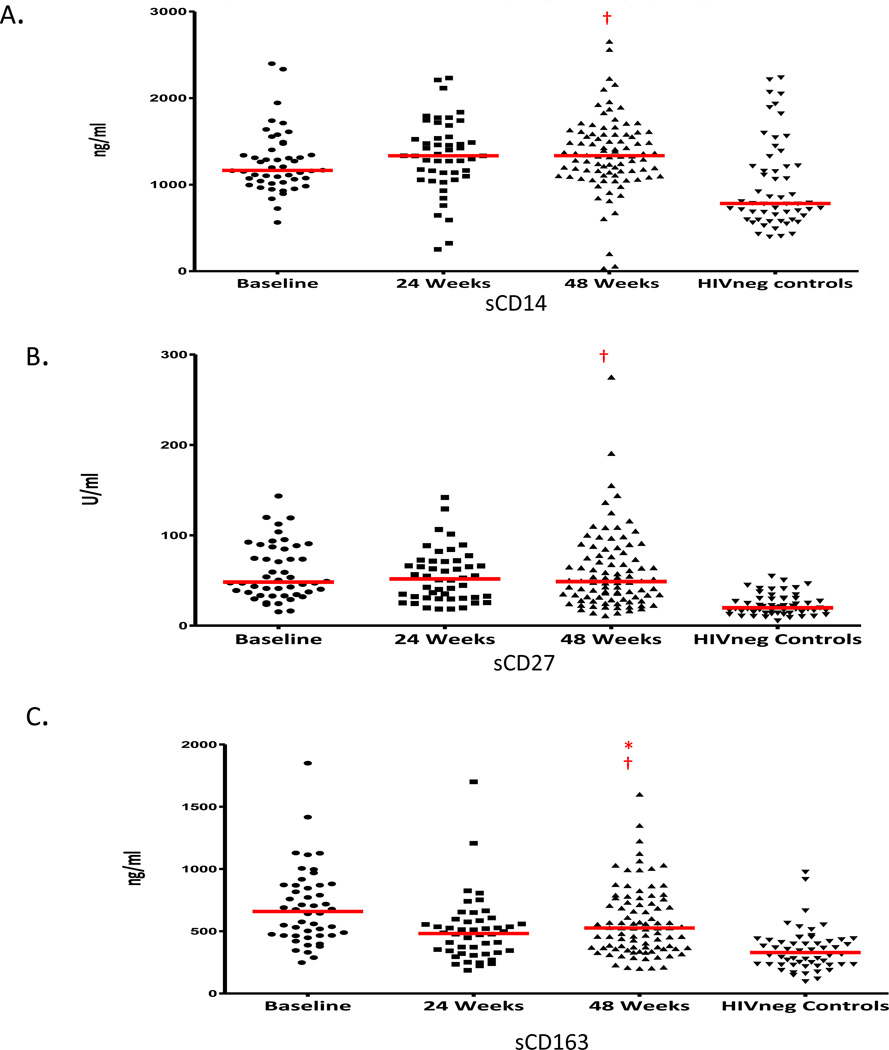
Figure 4. Trends in mean levels of plasma biomarkers of macrophage and lymphocyte activation.
Panels show levels of sCD14 levels (ng/ml) (panel A), sCD27 levels (U/ml) (panel B) and sCD163 levels (ng/ml) (panel C). The horizontal red line indicates mean values. Significant changes between baseline and 48 weeks in HIV+ subjects are represented with * (p<0.05, Wilcoxon Rank-Sum test). Significant differences between HIV+ subjects and HIV− controls are shown with † (p<0.05, Wilcoxon Rank-Sum test).

