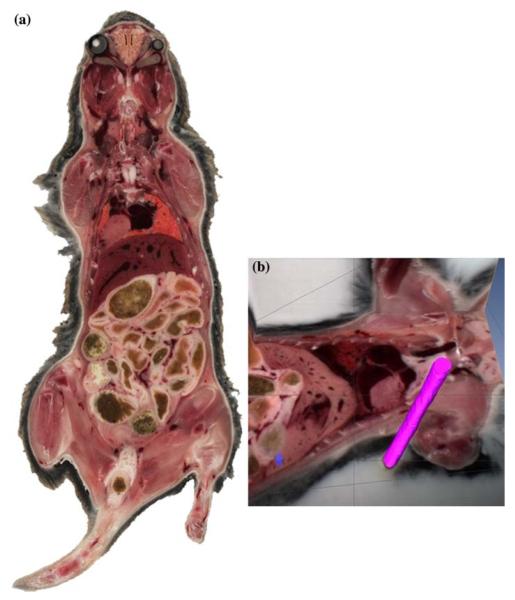
FIGURE 2.
Example cryo-image and evaluation of image alignment. A single 2D cryo-image of an entire mouse is shown (a). Different tissues are clearly distinguishable in the brightfield color image (a). A graphite fiducial was embedded in OCT alongside a mouse and cryo-imaged. Cryo-images were aligned with the graphite fiducial masked out of the images so it did not influence the alignment. The center of mass of the fiducial was determined in each cryo-image and fit to a straight line. The euclidian distance errors from a straight line were <1. The graphite fiducial was surface rendered and overlaid on a 2D brightfield cryo-image of the mouse.

