FIGURE 6.
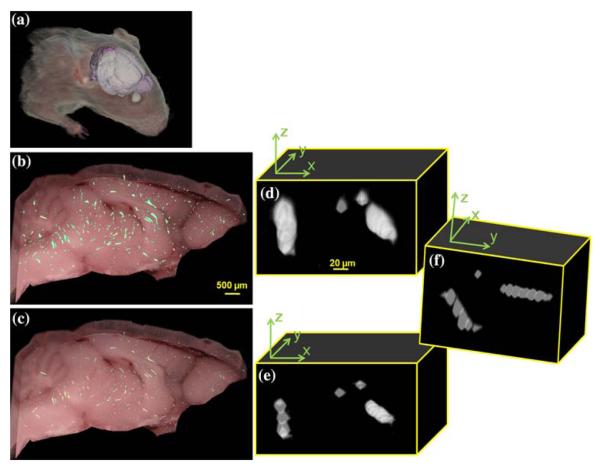
Volume rendering of brightfield and fluorescent cryo-images of fluorescent microspheres in a mouse brain. A surface rendering of the segmented brain is shown along with a brightfield volume rendering of the mouse (a). A slab of the fluorescent volume (100 images) was volume rendered and displayed on top of a brightfield image (b, c). Renderings of the microspheres from the original data (b) appear brighter than an identical rendering of the next-image processed data (c) due to the presence of out-of-plane fluorescence. Next-image processing was performed with μT = 161 cm−1 and σ = 11.2 μm. The distortion due to out-of-plane fluorescence is apparent in a zoomed in region of the brain showing only the volume rendered beads (d–f). Streaks due to outof-plane fluorescence are visible in the unprocessed data (d) that are clearly removed in the processed data (e, f). Because the microspheres were trapped in the microvasculature of the brain multiple microspheres often deposited next to one another and appear as a line segment outlining the vessel (e). By rotating the volume rendering it is possible to view the individual microspheres (f) that appear as a line segment from a different angle (e).

