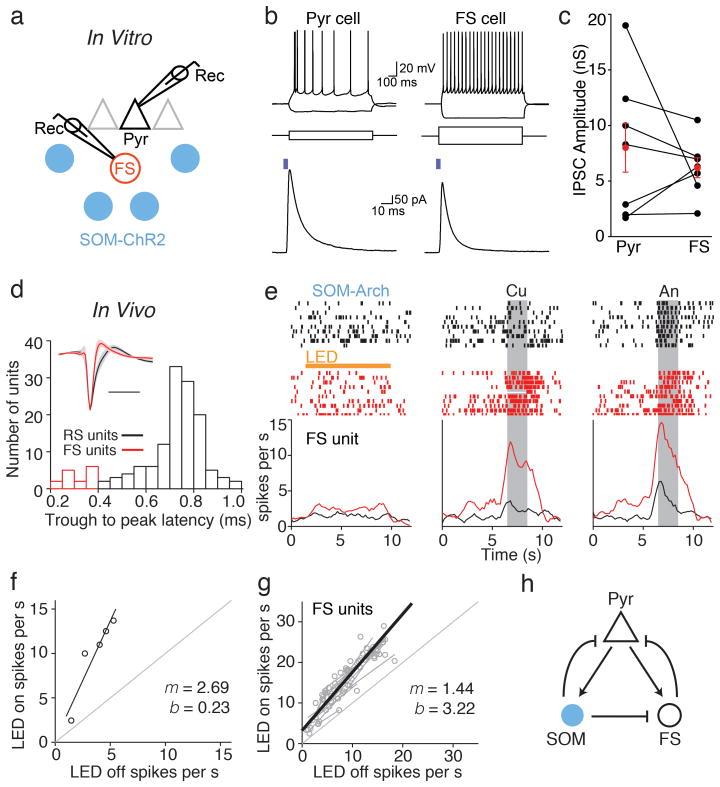
Figure 4. SOM cell suppression leads to the disinhibition of FS local interneurons.
a) Recording schematic for in vitro brain slice experiments. Whole cell recordings from pyramidal neurons (triangle) and nearby fast spiking (FS) cells (red circle) were used to measure IPSCs evoked by LED stimulation of ChR2-expressing SOM cells (blue circles). b) Top, membrane potential responses of a pyramidal (Pyr) cell (left) and FS cell (right) to depolarizing and hyperpolarizing current steps (middle). Bottom, LED illumination (blue bar, 4 ms, 470 nm) elicits IPSCs in the same cells recorded in voltage clamp (-50 mV). c) Summary of ChR2-evoked inhibitory conductances. Lines, individual Pyr-FS pairs; red circles, mean ± SEM. d) Isolation of FS units from in vivo recordings by waveform analysis. Histogram of trough to peak latency values with FS units indicated in red. Inset, average spike waveforms (solid lines) of RS and FS units. Shaded regions correspond to ± 1 standard deviation. e) Raster plots (top) and trial histograms (bottom) for control (black) and SOM cell photoinactivation (red) trials for a representative FS unit in the absence of odor (left) and in response to cumene (Cu) and anisole (An). f) Linear fit of the example unit in e. g) Summary of 12 FS units from 9 experiments (grey points and lines) and average of the linear fits (thick black line) demonstrating multiplicative scaling (slope m > 1) of FS firing rates across odorants. h) Inhibitory circuit schematic: optogenetic suppression of SOM cells (blue) causes both a direct reduction in the inhibition of Pyr cells (black triangle) as well as an indirect increase in inhibition mediated by FS cells (black circle).

