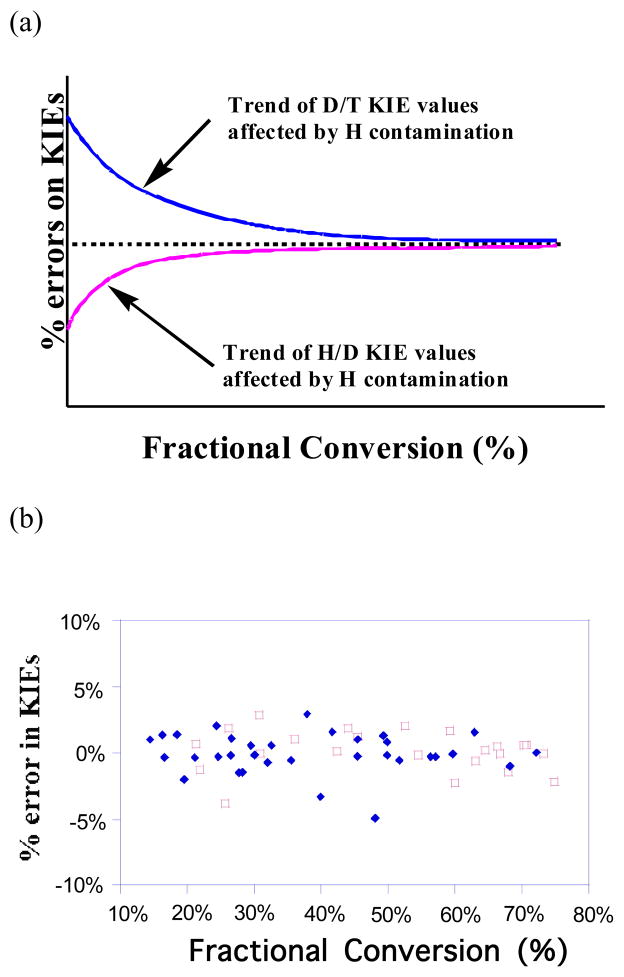
Figure 2.
Schematic illustration of the effects of H contamination on observed KIE values over fractional conversion. (a) Dotted line represents % error of KIEs with no H contamination (f independent KIEs). Solid lines represent the trends of affected H/D and D/T KIEs distribution due to the artifacts of H contamination. (b) Experimental data: Deviations of D/T (
 ) and H/D (
 ) KIEs from their average values are plotted vs. fractional conversion (f).

