
Fig 3. Effects of ozone treatment (6h, 300 ppb) on TPS10 and WT N. attenuata.
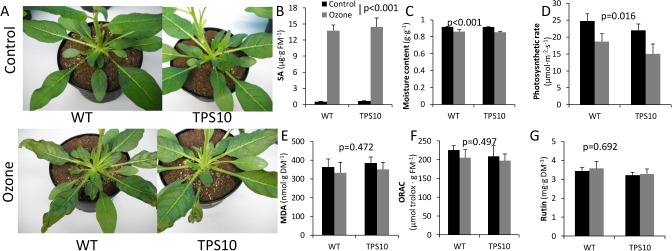
Control: black bars; ozone-treated: gray bars. (A) Representative rosettes of ozone-treated and control plants. P-value of ANOVA for overall treatment effect and mean+SEM (n = 4) for (B) salicylic acid (SA) in ozone-treated and control leaves; (C) leaf moisture; (D) photosynthetic rate at 2000 μmol irradiance (E) lipid peroxidation measured in malondialdehyde (MDA) equivalents; (F) Oxidative Radical Absorbance Capacity (ORAC); and (G) rutin, a flavonoid glycoside that was the most abundant phenolic compound in leaf extracts. All measurements were made from leaf tissue harvested immediately post- fumigation except for photosynthesis, which was measured from an on-plant leaf on the following day. DM, dry mass; FM, fresh mass.