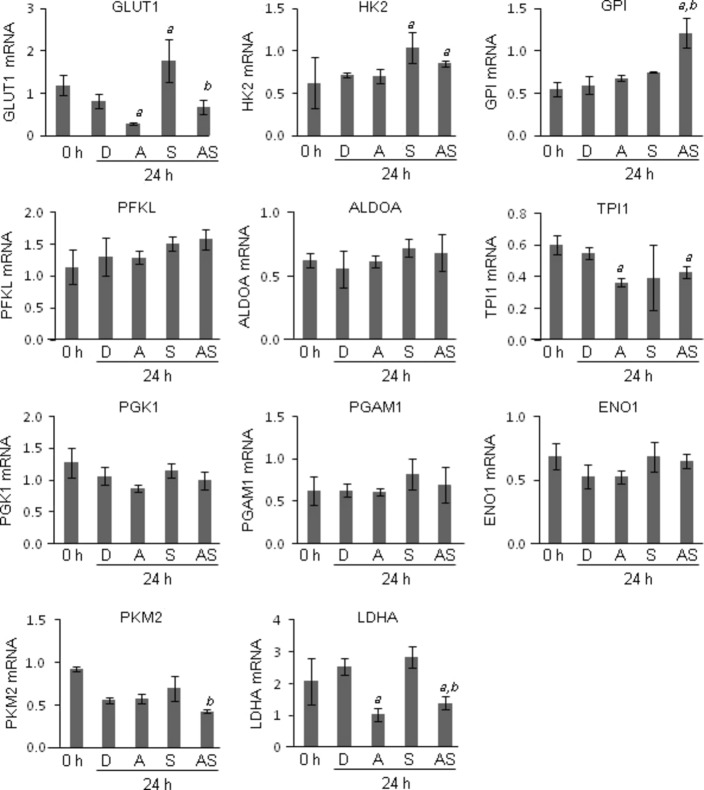
Fig 3.
Gene expression analysis of enzymes involved in the glycolytic pathway by quantitative RT-PCR. HepG2 hepatocellular carcinoma cells were treated with 0.1% DMSO (D), 0.1 μM sorafenib (S), and 10 μM all-trans retinoic acid (ATRA) alone (A), or in combination (AS), for 24 h. The mRNA expression of glucose transporter 1 (GLUT-1), hexokinase 2 (HK2), glucose-6-phosphate isomerase (GPI), phosphofructokinase, liver (PFKL), aldolase A (ALDOA), triosephosphate isomerase 1 (TPI1), phosphoglycerate kinase 1 (PGK1), phosphoglycerate mutase 1 (PGAM1), enolase 1 (ENO1), pyruvate kinase, muscle (PKM2), and lactose dehydrogenase A (LDHA) was determined by quantitative RT-PCR using gene-specific primers. The levels of mRNA expression were expressed as relative expression to GAPDH mRNA. a, P < 0.05 versus DMSO; b, P < 0.05 versus sorafenib alone. Experiments were run in triplicate and carried out once.

