
Fig 6. Protein expression levels of KPC-2 β-lactamase and variant enzymes.
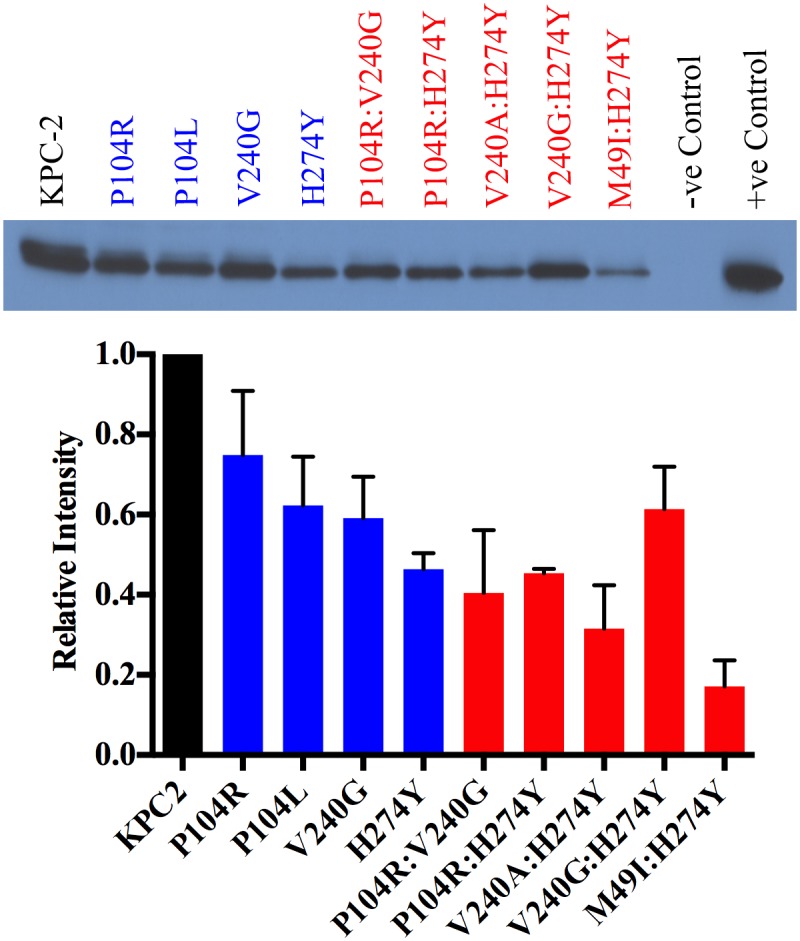
KPC-2 is represented in black, single mutants in blue and double mutants in red. Band intensities from two independent experiments were used to plot the bar graph.
Official websites use .gov
A
.gov website belongs to an official
government organization in the United States.
Secure .gov websites use HTTPS
A lock (
) or https:// means you've safely
connected to the .gov website. Share sensitive
information only on official, secure websites.
KPC-2 is represented in black, single mutants in blue and double mutants in red. Band intensities from two independent experiments were used to plot the bar graph.