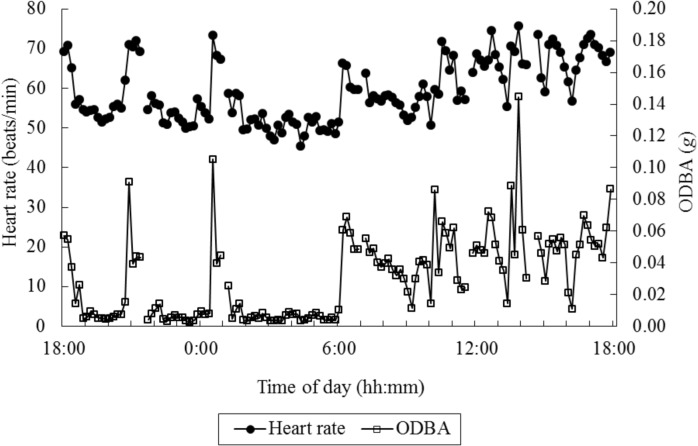
Fig 3. An example data plot of overall dynamic body acceleration (ODBA) and heart rate per minute over a 24-h recording.
The interruptions in the recording indicate the temporal interruptions of the heart rate recording, whereas ODBA was recorded continuously throughout the experiment. The interruptions in ODBA occurred due to the synchronization of the heart rate and ODBA for the data analysis.

