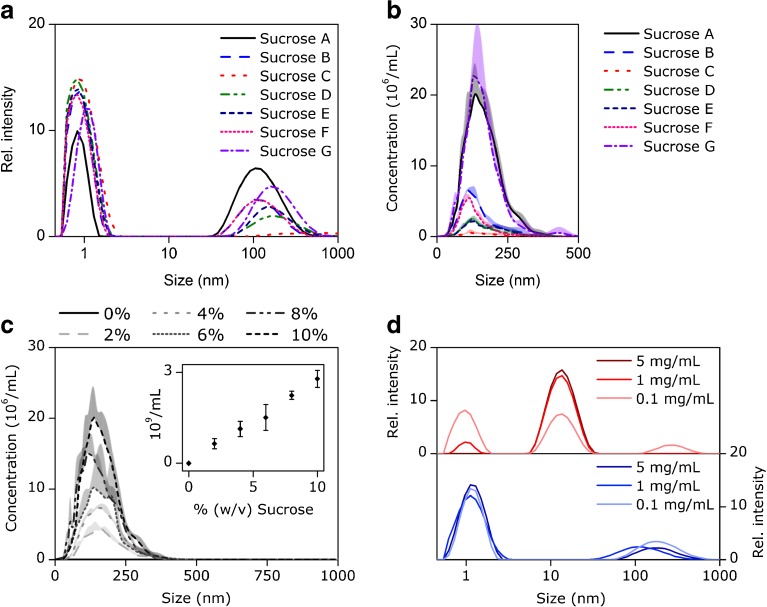
Fig. 1.
(a) Intensity-weighted size distribution by DLS and (b) particle size distribution by NTA obtained for different sugars in aqueous solution at 10%. (c) Total particle concentration (insert) and particle size distribution obtained by NTA for sucrose A solution from 0 to 10%. (d) Intensity-weighted size distribution by DLS for 7% sucrose A solutions containing increasing concentrations of IgG (upper panel) and lysozyme (lower panel). Shown are mean values (a-d) plus standard deviations (b and d) obtained from triplicate measurements.

