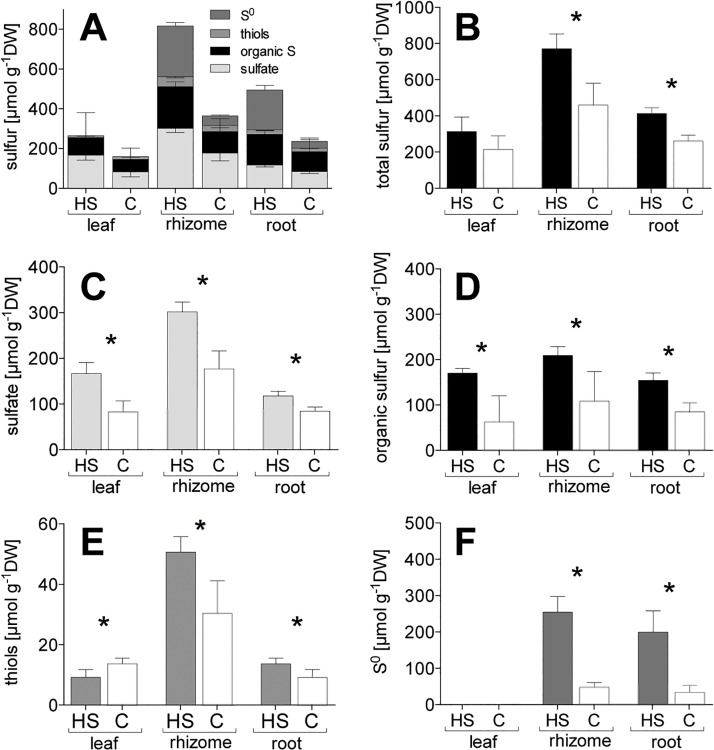
Fig 1. Sulfur budget of different fractions of Zostera marina in vitro (A) stacked values of all fractions, (B) total sulfur, (C) sulfate, (D) organic sulfur, (E) thiols, (F) S0.
Values represent mean ± SEM; n = 6. C, control; DW, dry weight; HS, high sulfide. Columns connected by the asterisk indicate significant intra-tissue differences (ANOVA and Tukey’s test, p < 0.05).

