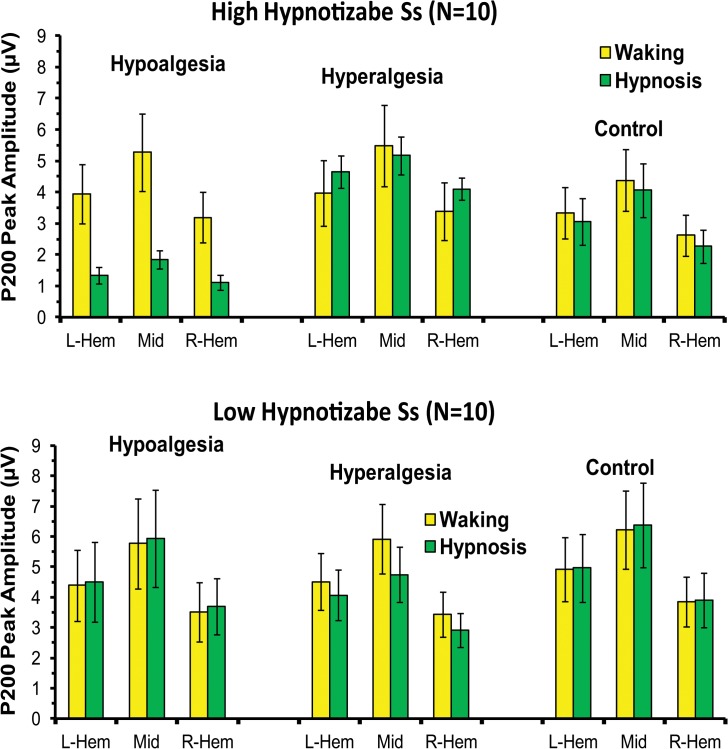
Fig 5. Mean amplitudes and standard errors of P200 peak amplitude averaged across left and right-hemisphere and medium head side (L-Hem, R-Hem, and Mid) for the Hypoalgesia, Hyperalgesia, and Control treatments during waking and hypnosis conditions in high (top panel) and low (bottom panel) hypnotizable subjects (HHs and LHs).
Both top and bottom histograms clearly shows larger positive peaks in the midline compared to the left and right sides as well as in the midline compared to right side. The top panel shows that in HHs, the hyperalgesia treatment during hypnosis had higher P200 amplitudes than control treatment, while hypnotic hypoalgesia had smaller peaks. These differences disappeared in waking condition. The bottom panel shows that LHs did not exhibit significant P200 amplitude differences between treatments in both waking and hypnosis conditions

