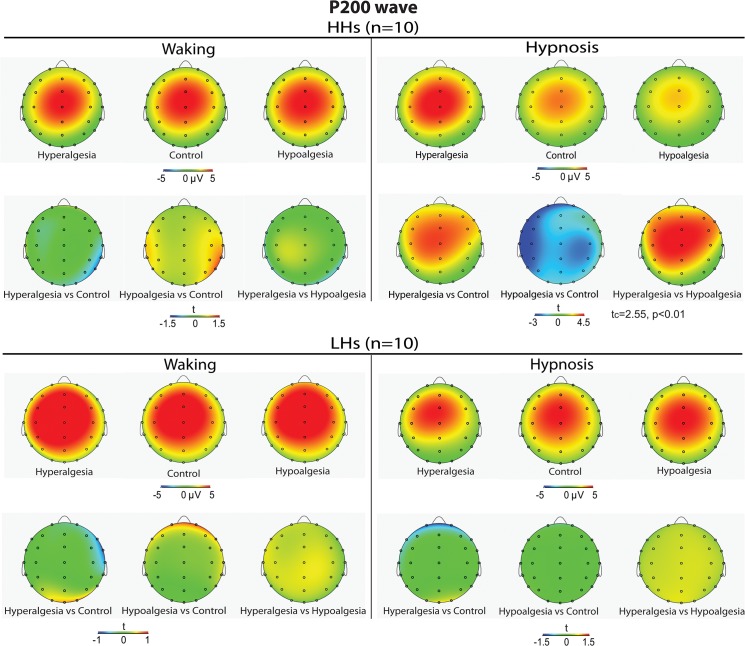
Fig 6. Averaged scalp topography of P200 wave (peaking at 220.4±3.8 ms within a time window of 200–250 ms) to Control, Hyperalgesia, and analgesia treatments in high (top-panel, first row) and low (bottom-panel, first row) hypnotizable participants (HHs and LHs) during waking (left panel) and hypnosis (right panel) conditions.
t-Test maps comparing the three treatments are shown in the second row of each top and bottom panel.

