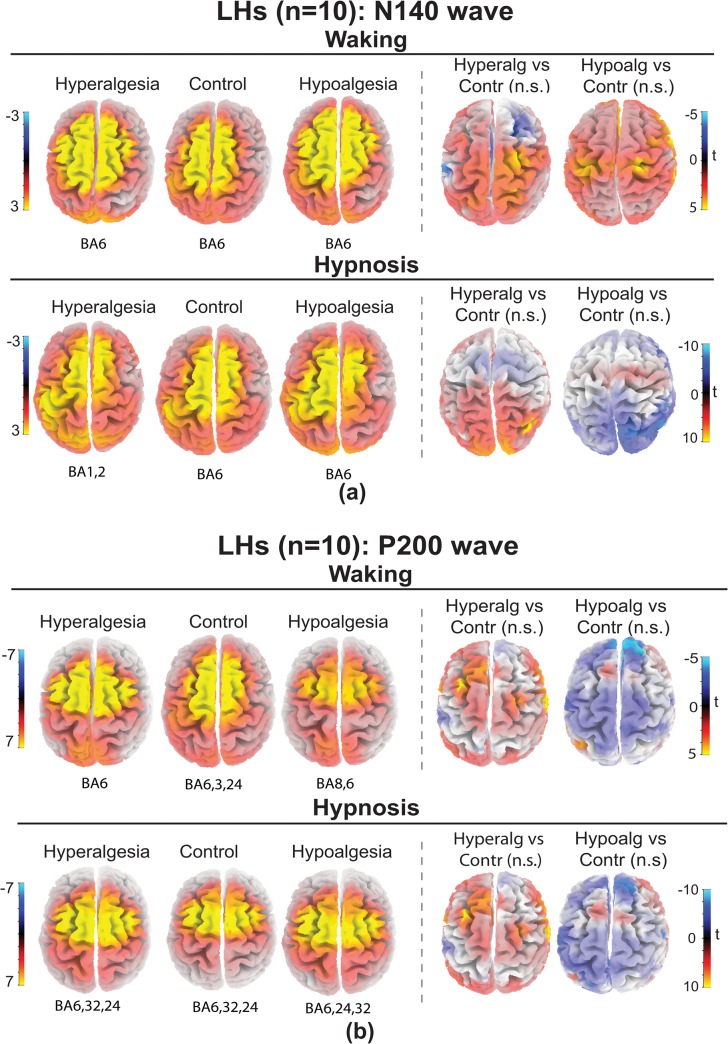
Fig 9. sLORETA solutions modeling the distributed sources for the N140 wave (panel a) and for the P200 wave (panel b) in low hypnotizable participants (LHs) in waking and hypnosis conditions to Hyperalgesia, Control, and Hypoalgesia treatments.
Brodmann areas (BA) of estimated sorces (local maxima in yellow color) are reported under each brain map. T-tests for both N140 (panel a) and P200 (panel b) waves between Hyperalgesia vs Control and Hypoalgesia vs Control did not yield significant differences in both waking and hypnosis conditions.

