Figure 2.
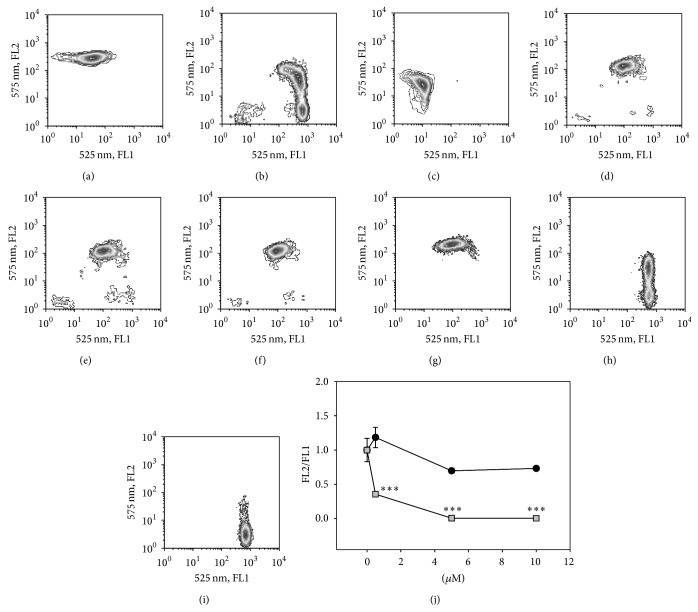
Analysis of the energized mitochondria of MDM-LPS and monocytes stained with the cyanine dye JC-1. Dot plots show JC-1_monomer FL1 (x-axes) and JC-1_aggregates FL2 (y-axes) of untreated ((a) MDM-LPS, (c) monocytes) and positive ((b) CCCP) controls; fullerene 1 treated MDM-LPS at 0.5 μM (d), 5 μM (e), and 10 μM (f). Fullerene 2 treated MDM-LPS, respectively, at 0.5 μM (g), 5 μM (h), and 10 μM (i). (j) displays the ratiometric assessment of mitochondrial polarization signals as FL2/FL1 (JC-1_aggregated/JC_1 monomer) of MDM-LPS cells treated for 24 hrs with fullerene 1 (circle) and fullerene 2 (square) at the concentrations shown on x-axes. Mean values ± SEM of at least three independent determinations: ∗∗∗ P < 0.01 versus untreated controls, post-ANOVA Student-Newman-Keuls multiple comparison test.

