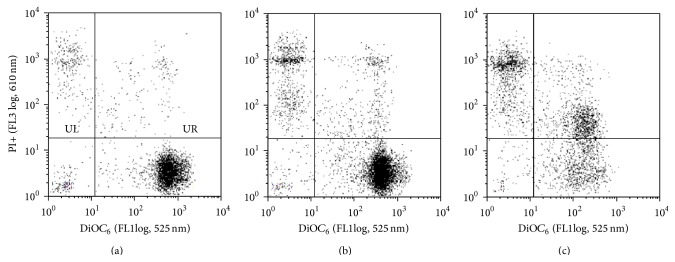
Figure 3.

Analysis of the apoptosis/necrosis by DiOC6/PI double staining. Representative dot plots showing MDM-LPS cells untreated (control, (a)) or after 24 h treatment with 25 μM fullerene 1 (b) and fullerene 2 (c). Quadrants: LR (DiOC6+/PI−); LL (DiOC6−/PI−); UR (DiOC6+/PI+); UL (DiOC6−/PI+).
