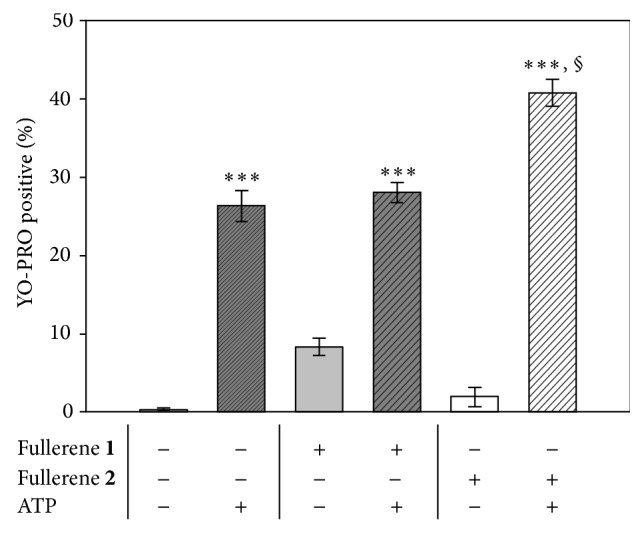
Figure 5.

Evaluation of the P2X7R opening in MDM-LPS. Flow cytometric measurement of control and treated cells, with 10 μM fullerenes (24 hr), stained with the YO-PRO fluorescent probe (solid histograms) or after addition of the agonist ATP (3 mM) (line pattern histograms). PI positive cells were gated out from the analysis and were below 10%. Mean values ± SEM of at least three independent determinations: ∗∗∗ P < 0.01 versus untreated/unstimulated controls (−) and § P < 0.05 versus ATP alone, post-ANOVA Student-Newman-Keuls multiple comparisons test.
