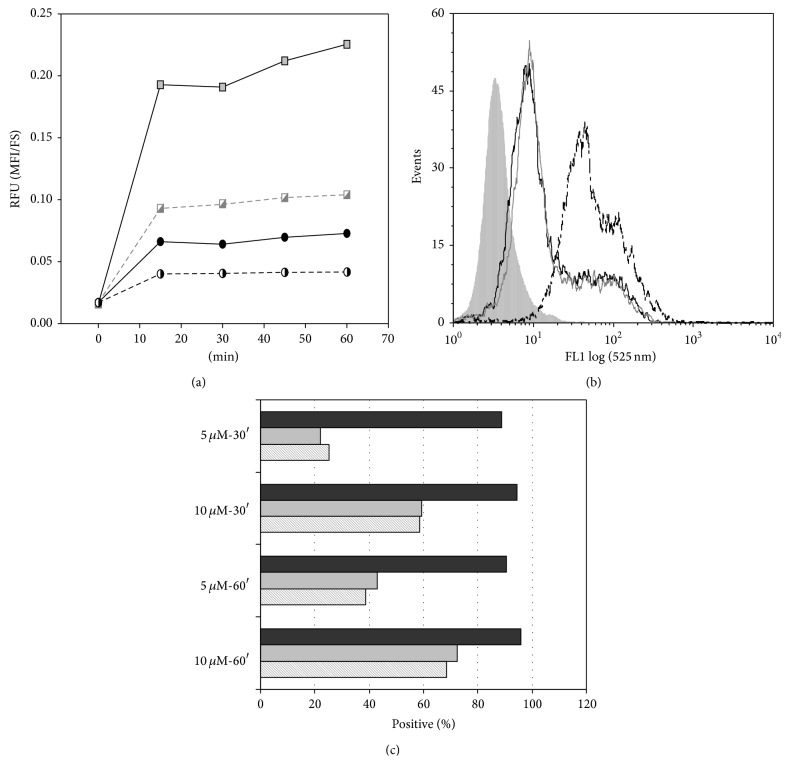
Figure 7.
Flow cytometric analysis of the binding/uptake of fullerene 1-FITC with MDM-LPS and monocytes. In (a), the kinetic assay, carried out at 37°C for MDM-LPS (square) and monocytes (circle) treated with 5 μM (half-filled symbols) or 10 μM (filled symbols), is shown as MFI signal referred to the forward scatter parameter. Overlays of (b) are representative of untreated (gray filled) or fullerene 1-FITC treated cells (for 60 minutes with 10 μM) without washout of unbound fullerene (black solid line) or after cell washing and addition of the TB quencher (gray and black thin lines). Histograms of (c) represent the percentage of positive cells stained with fullerene 1-FITC at the concentrations and times reported on y-axis without washing out of the fullerene (black), or after washing (gray) and subsequently addition of TB (line pattern histograms).

