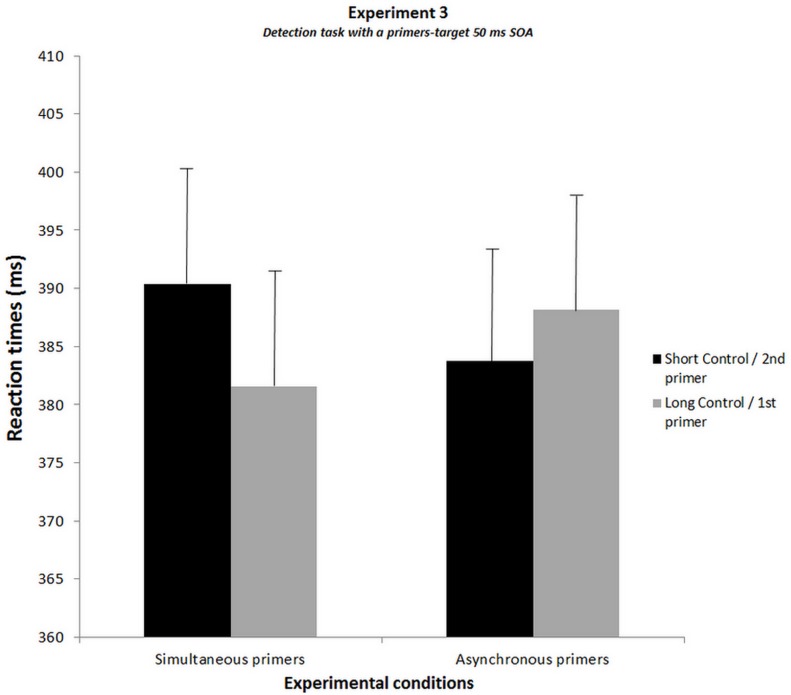
Fig 7. Results of Experiment 3 showing the results of the detection task with 50 ms SOA between primers and target.
The graph shows the reaction times averaged over subjects for each experimental condition. For simultaneous primers, the black histogram corresponds to the condition without additional SOA (short-control condition) and the grey histogram to the condition with an additional SOA of 17 ms (long-control condition). For asynchronous primers, the black histogram corresponds to the target in the location of the second primer and the grey histogram to the target in the location of the first primer. SEMs are shown for each mean.

