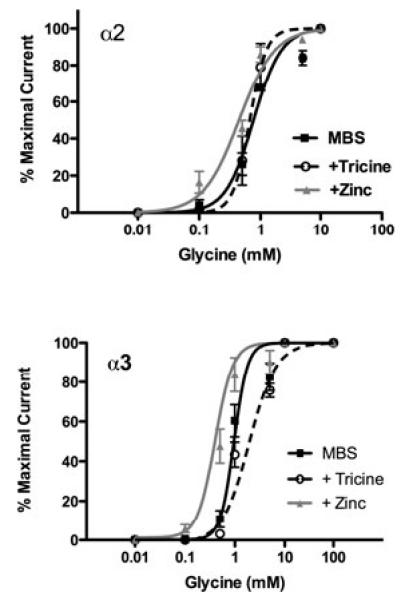
Figure 1.

Glycine concentration–response curves were generated for α2- and α3-GlyRs. (A) The responses of α2-GlyRs to a series of glycine concentrations (10 μM to 10 mM) in standard modified Barth’s solution (MBS), MBS with 10 mM tricine, and MBS with 1 μM added zinc. In the added zinc condition, the glycine EC50 was significantly reduced compared with both the MBS and tricine conditions, F(2, 15) = 15.54, p = 0.002, indicating a leftward shift in the curve; however, no differences in glycine EC50 were detected between the MBS and tricine conditions, F(2, 15) = 15.54, Tukey’s post hoc: p > 0.05. The Hill slopes were not significantly different among any of the 3 conditions, F(2, 15) = 2.56, p = 0.111. Mean ± SEM represent data from 6 oocytes. (B) The responses of α3-GlyRs to glycine (10 μM to 100 mM) in MBS, MBS with 10 mM tricine, and MBS with 1 μM added zinc. Significant differences were detected among all 3 conditions such that adding zinc significantly reduced the glycine EC50, and tricine significantly increased the glycine EC50 indicating that added zinc resulted in a leftward shift in the responses to submaximal concentrations of glycine, whereas chelating low nanomolar contaminating zinc resulted in decreased sensitivity to submaximal concentrations of glycine, F(2, 18) = 656.0, Tukey’s post hoc: p < 0.0001 for both zinc and tricine. In addition, significant differences in the Hill slopes were detected between the MBS and tricine conditions, F(2, 18) = 5.26, Tukey’s post hoc: p = 0.016. Mean ± SEM represent data from 7 oocytes.
