Figure 1.
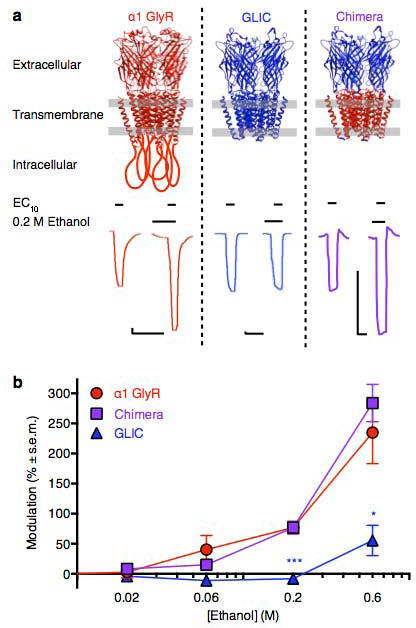
Ethanol modulation of human, bacterial, and chimera receptors. (a) Top panel- structural models of receptors studied. GlyRs (red) are represented by the X-ray structure of GluCl (PDB ID 3RIF), with the intracellular domain shown as manually drawn loops. GLIC (blue) and the GLIC/GlyR chimera are represented by the X-ray structure of GLIC (PDB ID 3EAM); chimera is colored according to the source of each domain. Gray lines represent plasma membrane boundaries. Bottom panel- sample traces showing EC10 activation by glycine (GlyR) or protons (GLIC, chimera) in the absence and presence of 200 mM ethanol. Scale bars are 200 nA, 2 min. (b) Modulation of human α1 GlyRs (red), GLIC (blue), and GLIC/GlyR chimeras (purple) at EC10 activation by various concentrations of ethanol. Errors are s.e.m., n = 4–8. Significance vs. chimera, Dunnet's multiple comparison test, analysis of variance, *p < 0.05; ***p < 0.001.

