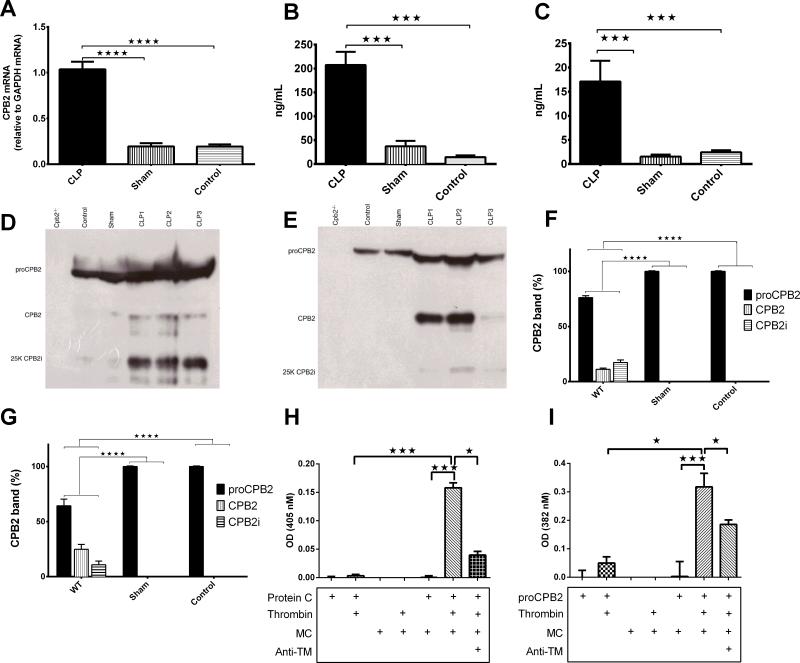
Fig. 3. CPB2 mRNA and protein is induced and CPB2 activated during polymicrobial sepsis.
(A-G) Groups of Cpb2−/− and WT mice with CLP plus WT sham-operated and control mice were sacrificed 48 hours after CLP. Data are shown from one of two independent experiments with similar results. Data were analyzed by one-way ANOVA with post-hoc Bonferroni correction. * p<0.05; ** p<0.01; *** p<0.001; **** p < 0.0001. (A) CPB2 mRNA determined by qPCR from liver at 48 hours. WT n = 3, sham n=3 control n=3. (B) CPB2 levels in plasma determined by ELISA at 48 hours. (C) CPB2 levels in peritoneal lavage determined by ELISA at 48 hours. WT n=14, sham n=5, control n=5. (D,E) proCPB2 (mw = 60,000), CPB2 (mw=35,000) and CPB2i (mw=25,000) detected by Western blot in plasma (D) and lavage (E). In each case, a representative experiment is shown from one of four independent experiments. (F,G) Levels of proCPB2, CPB2 and CPB2i in (F) plasma and (G) lavage from WT (n=15), sham (n=3) and control (n=3) animals were determined by scanning the Western blots with the total signal from one lane set to 100% and then the fraction present in each band was calculated. (H,I) MCs were prepared from trypsinization of the peritoneal lavage. MCs were incubated with the reagents shown below the graph as described in Methods before stopping the reaction with hirudin and measuring the activity of aPC (H) and CPB2 (I). Baseline readings for PC alone or proCPB2 alone, due to hydrolysis of the chromogenic substrates by proCPB2 itself (51), were subtracted. n=3-11.

