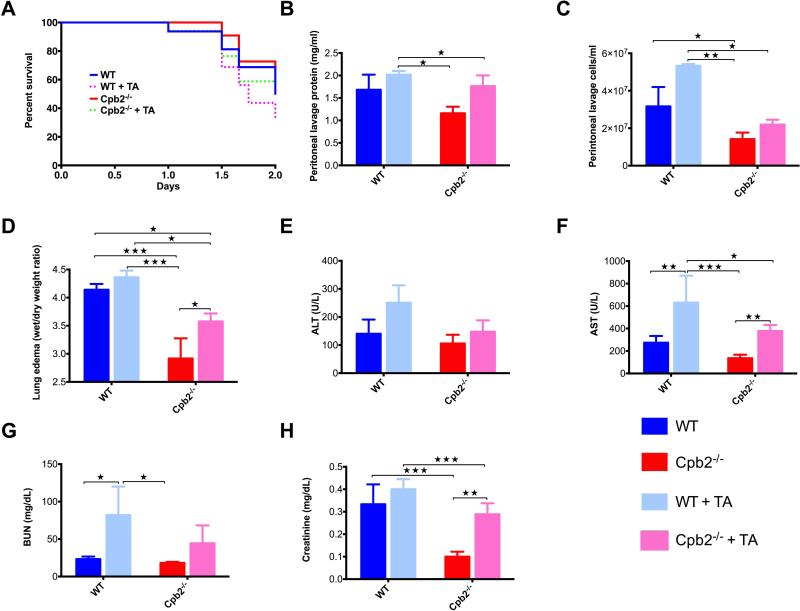
Fig. 5. Inhibition of fibrinolysis with TA does not equalize outcomes for Cpb2−/− and WT mice in polymicrobial sepsis.
(A) Kaplan-Meier survival curves comparing untreated Cpb2−/−, TA-treated Cpb2−/−, untreated WT to TA-treated WT in the CLP model (n=15 each genotype; TA treated vs untreated p=0.0241; WT + TA vs Cpb2−/−: p=0.049). (B-H) Groups of Cpb2−/− and WT mice with CLP untreated or treated with TA were sacrificed after 48 hours. Data are from one of three independent experiments with similar results. (B) Protein in peritoneal lavage. (C) Cells in peritoneal lavage (D) Lung edema (E) ALT, (F) AST, (G) BUN and (H) Creatinine in plasma at 48 hours. B – H: WT n=6, Cpb2−/− n=7, WT + TA n=5, Cpb2−/− + TA n=9. Closed columns: untreated; open columns treated. Data were analyzed by two-way ANOVA with post-hoc Fisher's least significant difference correction. * p<0.05; ** p<0.01; *** p<0.001.

