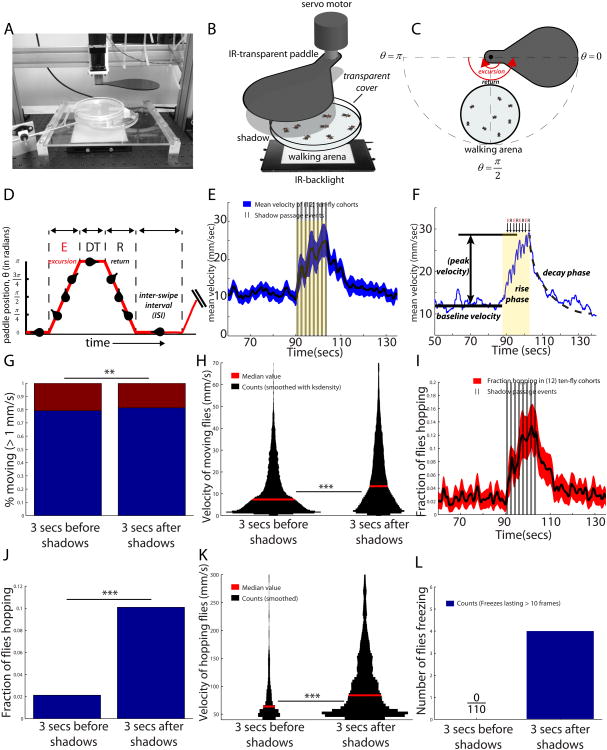
Figure 1.
Introduction to Repetitive Shadow-Induced Arousal (ReSA). (A-B) Shadow paddle apparatus. (C) Motion of the shadow paddle. (D) Control of swipe delivery. Dwell time (DT) and inter-shadow interval (ISI) control, respectively, how long the paddle remains at θ=π and θ=0. (E) Canonical ReSA curve for a cohort of ten male flies, with SEM envelopes. Shadow passes separated by an ISI of 1 second (vertical bars, black) cause an increase in velocity (yellow shaded region), which persists following stimulus cessation, and then decays back to baseline. (F) Illustration of baseline and peak height, as well as the three phases (“baseline,” “rise phase,”and “decay phase”). (G) Proportion of flies moving in the 3s before and after the shadow (**,Chi-square test). (H) Velocities of moving flies, in the 3s before and after the shadows (***, Kruskal-Wallis test). (I) Fraction of flies hopping over time (black), with SEM envelope (red). (J) Fraction of flies hopping increases relative to baseline (***,Chi-square test). (K) Velocity of hopping flies increases relative to baseline (***, Kruskal-Wallis test). Sample size for panels (E-K) is n=120 flies. (L) Number of flies freezing for ≥10 frames. Asterisks represent p-values, where (*), (**), and (***) denote, respectively, p<.05,p<.01, and p<.001. We use α=.05.

