
Figure 5.
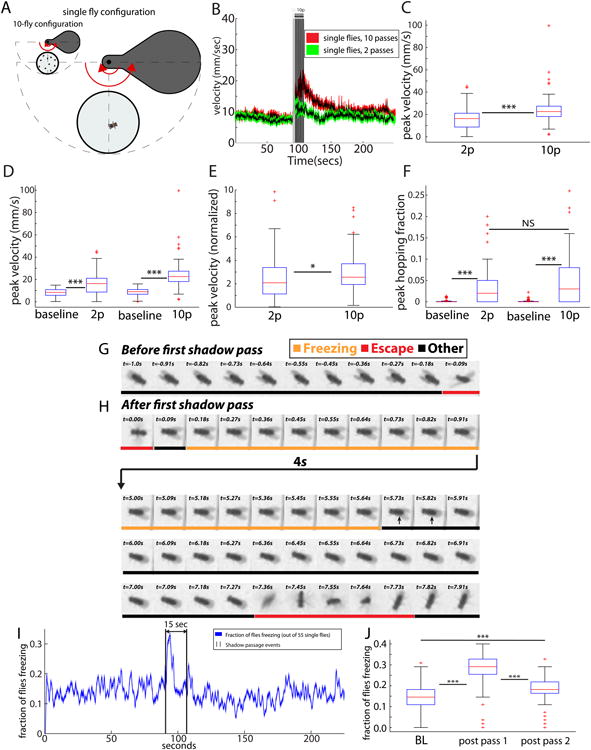
(A) Single-fly ReSA assay. (B) Time course for single fly velocities. For pass number p=10 (red envelope, black curve), the peak velocity is greater and it persists longer than for p=2 (green envelope, black curve). (C) Peak velocity for p=10 is significantly greater than for p=2 (***,Kruskal-Wallis test). (D) Peak velocities differ from baseline, and increase with p (***). (E) Peak velocity for p=10 is still greater than p=2 when normalized to baseline (*, Kruskal-Wallis test). (F) Peak hopping fraction for p=10 trends towards being greater than p=2; both values differ significantly from baseline (***). (G) Kymograph prior to the first pass (orange for freezing, red for escape, and black for other). (H) Kymograph following first shadow pass. Most time is spent freezing (orange label). Long arrow from t=.91 to t=5.00 s represents 4-seconds of freezing. After freezing, the fly escapes (red label). (I) Proportion of flies freezing vs time (see experimental procedures). Proportion freezing spikes following the first shadow (J) Shadow-induced elevation in the freezing rate (***). For panels B-F, the sample size is n=81 for each condition. Sample sizes for panels I-J are n=55 single flies. See also Movie S2.