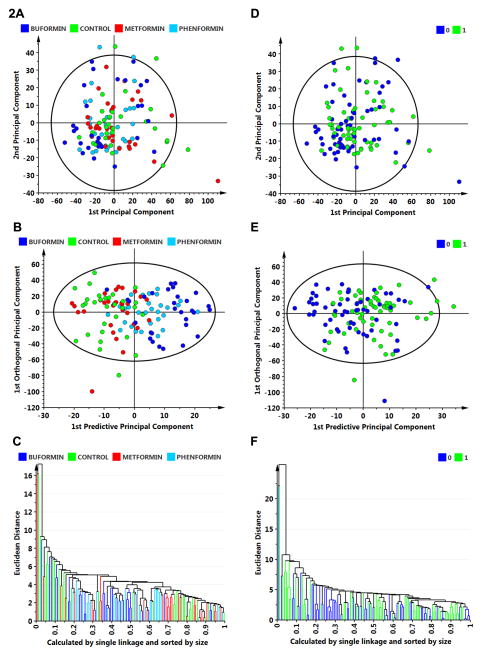
Figure 2.
Multivariate discriminant analysis was used to determine whether plasma analyte data could distinguish among treat groups (A–C) or whether an animal was cancer bearing versus cancer free (D–F). A, to visualize inherent clustering patterns, the scatter plot represents unsupervised analysis through the PCA 4-class model. Poor separation of treatment groups is observed. Model fit: R2X(cum)= 0.437, and Q2(cum)= 0.093. B, to determine contributing sources of variation, the scatter plot represents supervised analysis of the 4-class OPLS-DA model, which rotates the model plane to maximize separation due to class assignment. Separation is still poor with an overall misclassification rate of 45%. Model fit: R2Y(cum)= 0.199, Q2Y(cum)= 0.132. C, to visualize the misclassification rate, the dendrogram depicts hierarchical clustering patterns among treatment groups using single linkage and size. D, to visualize inherent clustering patterns, the scatter plot represents unsupervised analysis through the PCA 2-class model. Poor separation of treatment groups is observed for the categories: cancer free = 0 versus cancer bearing = 1. E, to determine contributing sources of variation, the scatter plot represents supervised analysis of the 2-class OPLS-DA model, which rotates the model plane to maximize separation due to class assignment. Separation is still poor with an overall misclassification rate of 55%. Model fit: R2Y(cum) = 0.124, Q2Y(cum) = 0.080. F, to visualize the misclassification rate, the dendrogram depicts hierarchical clustering patterns among treatment groups using single linkage and size.

