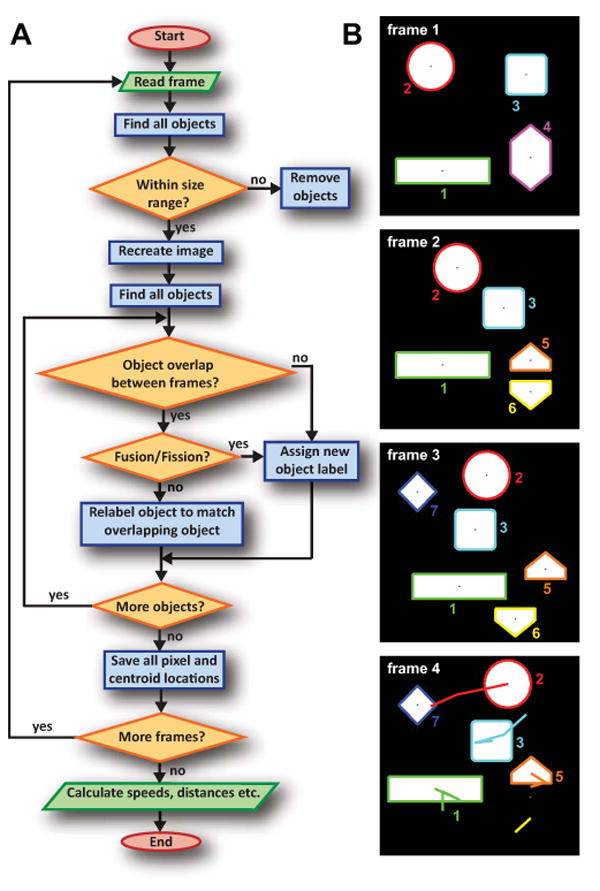
Figure 2. Matlab based algorithm tracks centroid locations of all objects as they travel throughout a time-lapse recording.

A Flowchart of algorithm used to calculate net distances traveled by mitochondria over the course of a 5 minute video.
B Illustration of the algorithm's results for artificial sample data. A comparison of frame 1 to frame 2 shows that object 4 has split into objects 5 and 6, necessitating new labels. In addition, all other objects have moved. Object 7 newly appears in frame 3, and object 6 has disappeared in frame 4. The centroid paths from the first frame are traced in the final frame. The path shown below object 5 is from object 6 (sample data lifetime is not limited to 4 frames as true data are).
