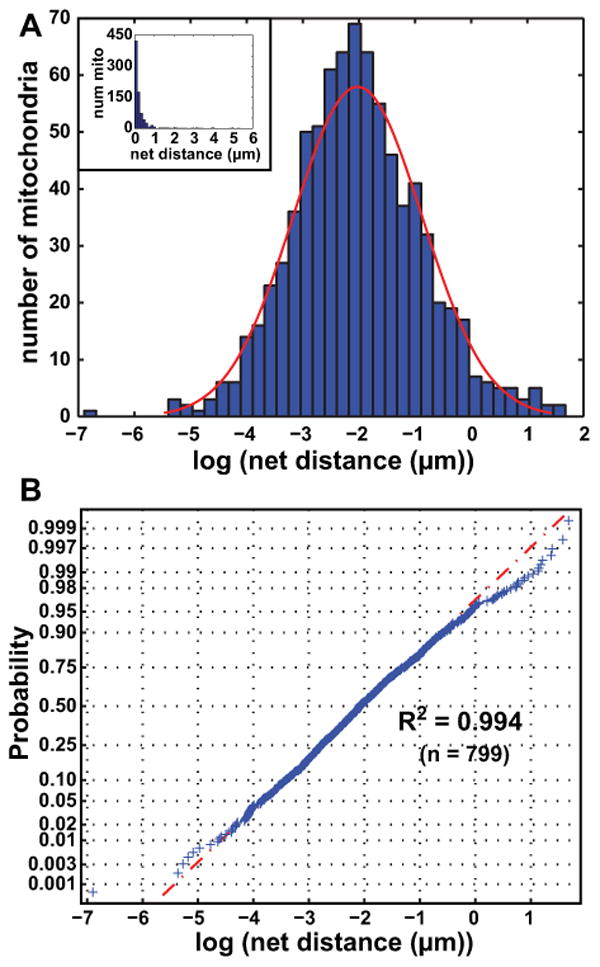
Figure 3. Net distances traveled by mitochondria are lognormally distributed.

A Histogram of log values of net distances traveled by all mitochondrial objects satisfying our size and lifetime inclusion criteria in a given control cell over the video. A normal distribution (red) has been overlaid onto the histogram, with a mean of -2.023 (=135.3 nm) and standard deviation of 1.150. Inset: histogram of net distances traveled by mitochondria without the log transformation.
B Normal probability plot of the logs of net mitochondrial distances traveled. The data give an R2 of 0.994 when fit to a lognormal distribution.
