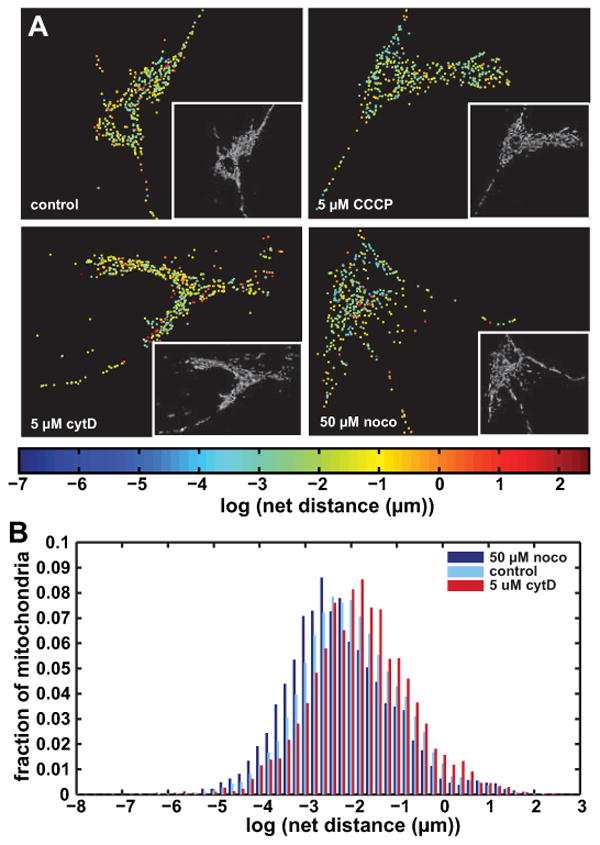
Figure 4. CCCP and nocodazole lower the distribution of net distances traveled by mitochondria while cytochalasin D raises it.

A Images of representative cells from the control, 5 μM CCCP, 5 μM cytD and 50 μM noco groups. Each dot represents a mitochondrial object in its final location after tracking, and is colored by the log of the net distance traveled. Inset into each figure is the first pre-processed binary image from the corresponding video.
B Grouped histograms of net distances traveled by mitochondria in control, 50 μM noco and 5 μM cytD groups. Mitochondria are pooled together from 5-17 cells per group, with a total mitochondrial number of 4323 (cytD), 5530 (noco) and 19334 (control). HIstograms are normalized to reflect percentages of objects rather than absolute numbers.
