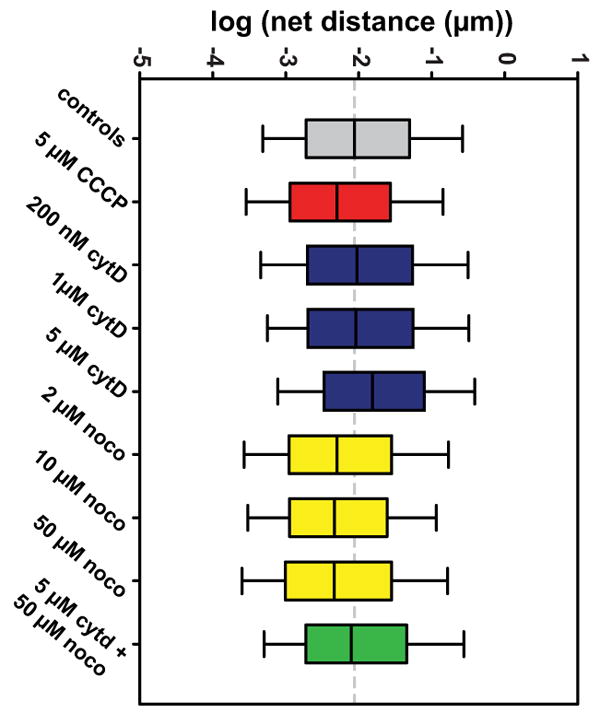
Figure 5. Box plots showing data from all groups.

Whiskers extend to 10th and 90th percentiles of data. The median of the control group is extended throughout the plot as a dashed gray line.

Whiskers extend to 10th and 90th percentiles of data. The median of the control group is extended throughout the plot as a dashed gray line.