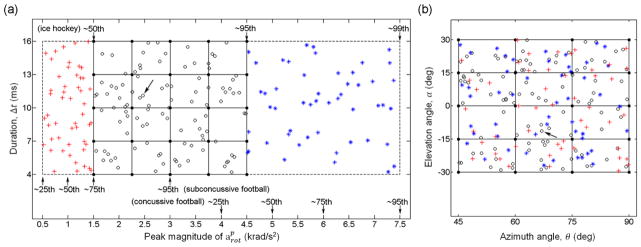
Fig. 4.

Distribution of the training (black dots) and testing (circles, crosses and stars for in-range interpolation and below- and above-range extrapolation, respectively) datasets as orthogonal 2D projections of the 4D data points on the (a) and θ-α planes (b). Locations for representative values that approximately correspond to characteristic on-field measurements are also shown. Kinematic variable values for one representative interpolation testing data point are: , Δt = 11.1 ms, θ = 66.9°, α = − 11.4° (arrows).
