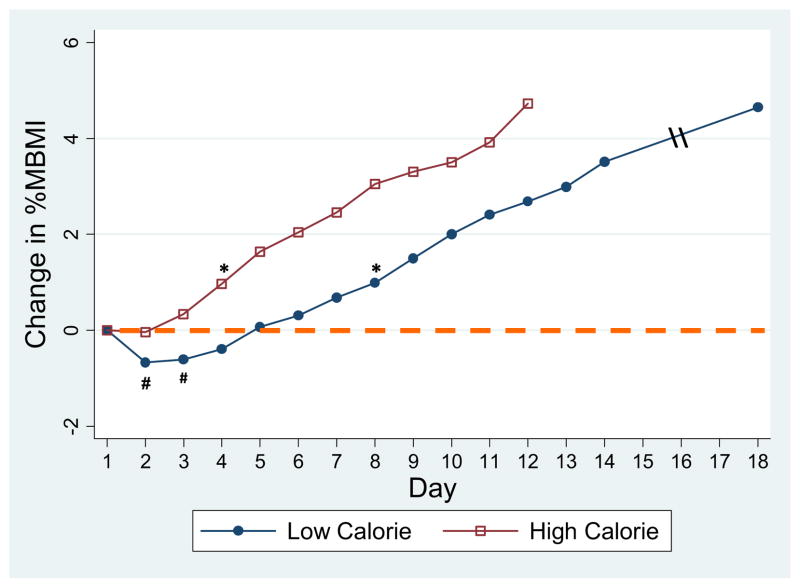
Figure 2.
Comparison of change in %median body mass index (%MBMI) in subjects on lower calorie versus higher calorie diets. - - -Baseline %MBMI, calculated from admit (day 1) height and weight. #%MBMI in lower calorie group on days 2 and 3 was significantly lower than day 1 (p < .05). *%MBMI on was significantly greater than day 1 on day 4 (and thereafter) in the higher calorie group and D8 in the lower calorie group (all p < .05).

