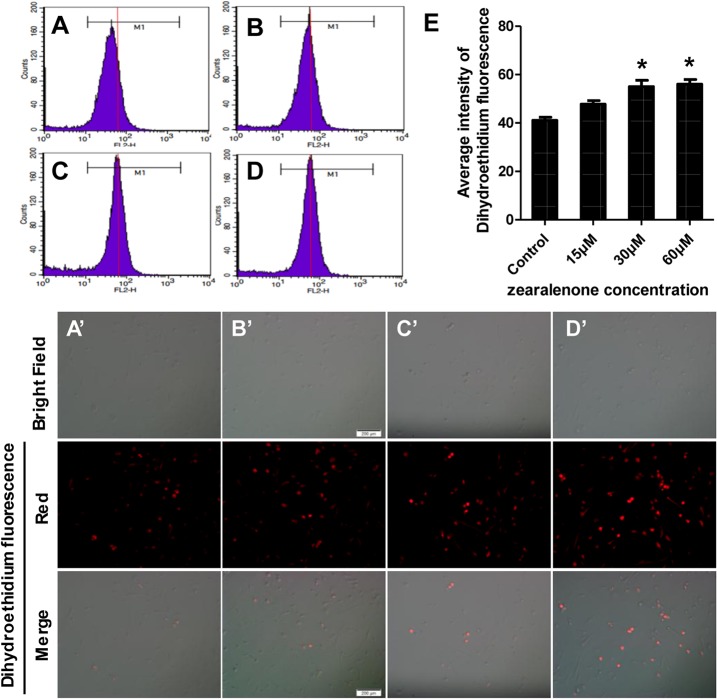
Fig 4. Intracellular ROS levels assayed with dihydroethidium fluorescent probe in porcine granulosa cells treated with zearalenone.
A (A’), Control (untreated); B (B’), 15 μM ZEA; C (C’), 30 μM ZEA; D (D’), 60 μM ZEA. Intracellular ROS was measured by flow cytometry (A-D) and microscope and fluorescence imaging (A’-D’) by detecting the signals of superoxide anion in cells. For better clarity, a guidance line (red) is drawn through histograms for comparison. E, Average intensity of dihydroethidium. The results are expressed as mean ± SD. Asterisk (*) indicates significant difference (P < 0.05)

