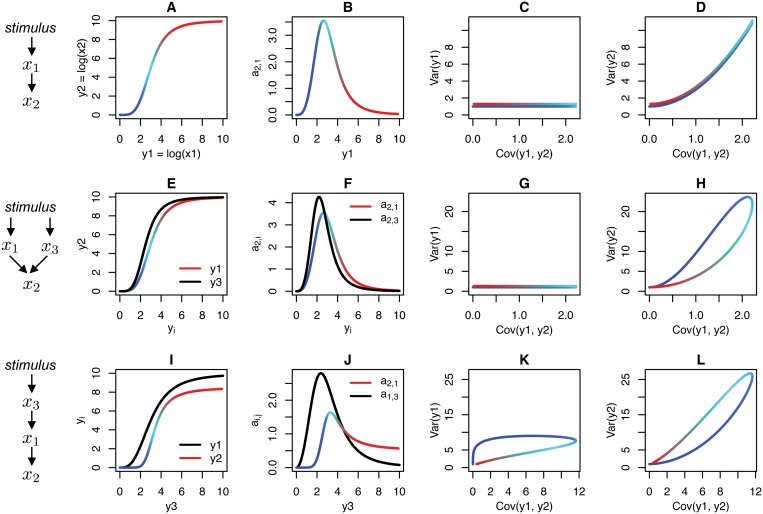
Fig 2. INDUCE (Inference of Network Directionality Using Covariance Elements) analysis for hypothetical model networks.
(A-D) INDUCE analysis of an isolated network connection. From left to right, (A) the Hill equation model of log concentration transfer function is color registered to y 2. (B) The derivative of the transfer function is the network connection strength a 2,1, which peaks at half-maximal activation. (C-D) Variance versus covariance plots, the solution to Eq 8 applied at closely-spaced fixed points along the transfer function shown in A. (E-H) INDUCE analysis of a convergent (additive) regulation of node 2. The transfer function y 2 versus y 3 shown in black. (F) The connection strength a 2,3 shown in black. (H) Var(y2) versus Cov(y1, y2) has a loop, a hallmark of differential sensitivities to a stimulus. (I-L) INDUCE analysis of a linear cascade. (K, L) Both variance versus covariance plots exhibit loops, a hallmark of differential sensitivities to a stimulus. In all examples, biochemical parameters were chosen to illustrate qualitative differences in the variance versus covariance plots for different connectivities (see Section D in S1 text for parameter values).

